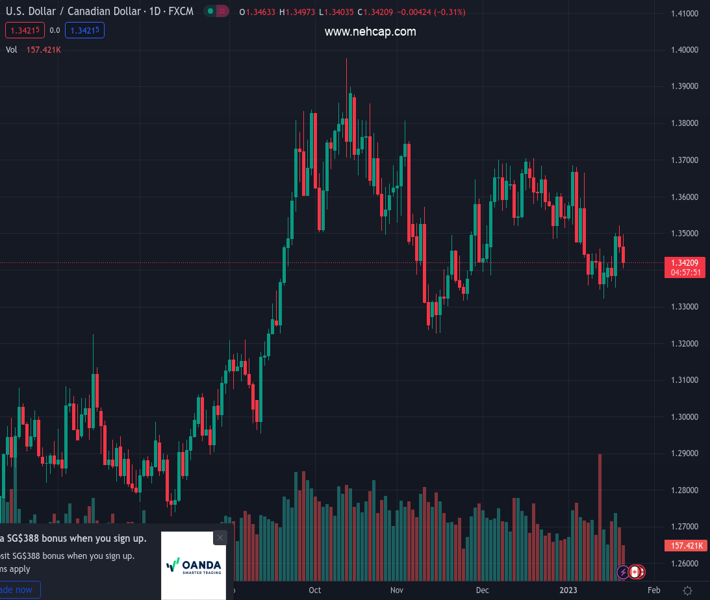
#USDCAD @ 1.34209 US Existing Home Sales continue to deteriorate and weigh on the US Dollar. (Pivot Orderbook analysis)
…
This is a premium post.
[s2If !current_user_can(access_s2member_level4)]Please register for PREMIUM VERSION HERE to read full post below containing analysis. In case of any error or you think you are not able to read the full post below, please email us at support#nehcap.com [lwa][/s2If] [s2If current_user_can(access_s2member_level4)]
- US Existing Home Sales continue to deteriorate and weigh on the US Dollar.
- Retail Sales in Canada dropped, though improved in November, compared with October.
- Fed’s Patrick Harker supports 25 bps rate hike increases to the Federal Funds rate.
The pair currently trades last at 1.34209.
The previous day high was 1.3521 while the previous day low was 1.3447. The daily 38.2% Fib levels comes at 1.3475, expected to provide resistance. Similarly, the daily 61.8% fib level is at 1.3492, expected to provide resistance.
USD/CAD is registering moderate losses during the North American session, falling from daily highs nearby 1.3500 after the release of US and Canadian data, bolstering the Loonie (CAD), which is trimming some of its weekly losses. At the time of writing, the USD/CAD exchange hand is at 1.3418, below its opening price.
Wall Street portrays an upbeat sentiment. The economic calendar in the United States (US) reported that Existing Home Sales for December retreated for the eleventh consecutive month. Sales retreated by 1.5% from November.
“December was another difficult month for buyers, who continue to face limited inventory and high mortgage rates,” said NAR Chief Economist Lawrence Yun. “However, expect sales to pick up again soon since mortgage rates have markedly declined after peaking late last year.”
Across the border, Canada’s docket reported retail sales, which dropped by -0.1% MoM in November but improved as October’s data showed sales plunging -0.5%, according to Statistics Canada.
Aside from economic data releases, the USD/CAD was also underpinned by an upbeat market sentiment. The pair dropped beneath the 20-day Exponential Moving Average (EMA) at 1.3470 and also tumbled below the 100-day EMA at 1.3426. Hence, the USD/CAD bias is shifting from neutral-biased to neutral-bearish.
Elsewhere, a slew of Fed officials, namely Philadelphia Fed President Patrick Harker, opened the door for a downshift in interest rate increases, saying “Hikes of 25 basis points will be appropriate going forward.” He expects the US economy to grow by 1% and the unemployment rate to jump to 4.5% from 3.5%. Later, KansasCiti Fed President Esther George said that the Federal Reserve must be “patient” to see if inflation in the services sector is waning.
Technical Levels: Supports and Resistances
USDCAD currently trading at 1.3409 at the time of writing. Pair opened at 1.3466 and is trading with a change of -0.42 % .
| Overview | Overview.1 | |
|---|---|---|
| 0 | Today last price | 1.3409 |
| 1 | Today Daily Change | -0.0057 |
| 2 | Today Daily Change % | -0.4200 |
| 3 | Today daily open | 1.3466 |
The pair is trading below its 20 Daily moving average @ 1.3496, below its 50 Daily moving average @ 1.3498 , below its 100 Daily moving average @ 1.351 and above its 200 Daily moving average @ 1.3186
| Trends | Trends.1 | |
|---|---|---|
| 0 | Daily SMA20 | 1.3496 |
| 1 | Daily SMA50 | 1.3498 |
| 2 | Daily SMA100 | 1.3510 |
| 3 | Daily SMA200 | 1.3186 |
The previous day high was 1.3521 while the previous day low was 1.3447. The daily 38.2% Fib levels comes at 1.3475, expected to provide resistance. Similarly, the daily 61.8% fib level is at 1.3492, expected to provide resistance.
Note the levels of interest below:
- Pivot support is noted at 1.3435, 1.3404, 1.3361
- Pivot resistance is noted at 1.3509, 1.3552, 1.3583
| Levels | Levels.1 |
|---|---|
| Previous Daily High | 1.3521 |
| Previous Daily Low | 1.3447 |
| Previous Weekly High | 1.3461 |
| Previous Weekly Low | 1.3322 |
| Previous Monthly High | 1.3705 |
| Previous Monthly Low | 1.3385 |
| Daily Fibonacci 38.2% | 1.3475 |
| Daily Fibonacci 61.8% | 1.3492 |
| Daily Pivot Point S1 | 1.3435 |
| Daily Pivot Point S2 | 1.3404 |
| Daily Pivot Point S3 | 1.3361 |
| Daily Pivot Point R1 | 1.3509 |
| Daily Pivot Point R2 | 1.3552 |
| Daily Pivot Point R3 | 1.3583 |
[/s2If]
Join Our Telegram Group
")


