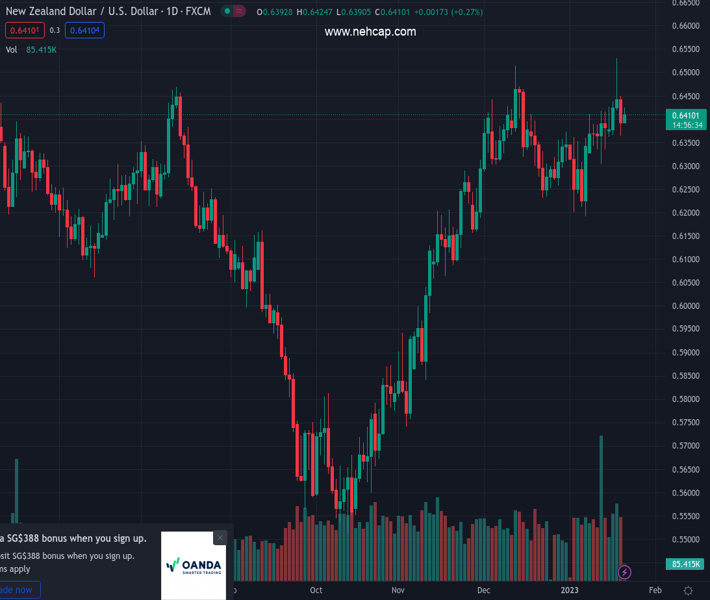
#NZDUSD @ 0.64114 clings to mild gains during two-week uptrend. (Pivot Orderbook analysis)
…
This is a premium post.
[s2If !current_user_can(access_s2member_level4)]Please register for PREMIUM VERSION HERE to read full post below containing analysis. In case of any error or you think you are not able to read the full post below, please email us at support#nehcap.com [lwa][/s2If] [s2If current_user_can(access_s2member_level4)]
- NZD/USD clings to mild gains during two-week uptrend.
- Cautious optimism in the market joins sluggish US Treasury yields, USD to favor buyers.
- Hawkish Fedspeak, recession fears probe upside momentum amid light calendar.
The pair currently trades last at 0.64114.
The previous day high was 0.645 while the previous day low was 0.6365. The daily 38.2% Fib levels comes at 0.6397, expected to provide support. Similarly, the daily 61.8% fib level is at 0.6418, expected to provide resistance.
NZD/USD remains mildly bid around 0.6415 as the Kiwi bulls cheer the upbeat sentiment amid sluggish hours of early Friday’s trading. In doing so, the quote reverses the previous day’s losses while bracing for the second consecutive weekly gain.
The risk-on mood could be linked to the hopes of more stimulus from China, mainly after the People’s Bank of China’s (PBOC) fifth monthly inaction. On the same line could be the challenges for the Federal Reserve’s (Fed) rate hike trajectory emanating from the downbeat US data.
On Thursday, the US Unemployment Claims dropped to the lowest levels since late April 2022 and the Philadelphia Fed Manufacturing Survey Index also improved However, US Building and Housing Starts joined the previously release downbeat US Retail Sales and Producer Price Index (PPI) to propel fears of a recession in the world’s largest economy, earlier backed by the softer wage growth and activity data from the US.
It should be observed that New Zealand’s Business NZ PMI for December and Visitor Arrivals for November both eased in their latest readings and challenge the Kiwi pair buyers of late.
Alternatively, the US Dollar Index (DXY) picks up bids to 102.15 as it consolidates the previous day’s losses, the biggest in over a week, as Fed policymakers favor higher rates during their last public appearances before the 15-day silence period ahead of the February Federal Open Market Committee (FOMC) meeting. It’s worth noting that the latest tension surrounding Taiwan also seems to probe the NZD/USD bulls.
Amid these plays, the key US Treasury bond yields struggle to extend the previous day’s rebound from the multiday low while the S&P 500 Futures print mild gains. That said, stocks in the Asia-Pacific region trade mixed at the latest.
Moving on, a lack of major data/events, as well as hawkish Fedspeak, could challenge the NZD/USD pair’s upside ahead of the key week comprising multiple activities, inflation and growth numbers for the key economies.
The 100-bar Exponential Moving Average (EMA) joins the 50-EMA and the weekly support-turned-resistance to challenge the NZD/USD bulls around 0.6415. However, the previous day’s low of 0.6365 restricts the immediate downside of the quote, a break of which will highlight the 61.8% Fibonacci retracement level of the NZD/USD pair’s January 06-18 upside, near 0.6315.
Technical Levels: Supports and Resistances
NZDUSD currently trading at 0.6412 at the time of writing. Pair opened at 0.6398 and is trading with a change of 0.22% % .
| Overview | Overview.1 | |
|---|---|---|
| 0 | Today last price | 0.6412 |
| 1 | Today Daily Change | 0.0014 |
| 2 | Today Daily Change % | 0.22% |
| 3 | Today daily open | 0.6398 |
The pair remains strongly bullish on the daily timeframe. It trades above its 20 SMA @ 0.6342, 50 SMA 0.6304, 100 SMA @ 0.6061 and 200 SMA @ 0.6202.
| Trends | Trends.1 | |
|---|---|---|
| 0 | Daily SMA20 | 0.6342 |
| 1 | Daily SMA50 | 0.6304 |
| 2 | Daily SMA100 | 0.6061 |
| 3 | Daily SMA200 | 0.6202 |
The previous day high was 0.645 while the previous day low was 0.6365. The daily 38.2% Fib levels comes at 0.6397, expected to provide support. Similarly, the daily 61.8% fib level is at 0.6418, expected to provide resistance.
Note the levels of interest below:
- Pivot support is noted at 0.6359, 0.6319, 0.6274
- Pivot resistance is noted at 0.6444, 0.6489, 0.6529
| Levels | Levels.1 |
|---|---|
| Previous Daily High | 0.6450 |
| Previous Daily Low | 0.6365 |
| Previous Weekly High | 0.6418 |
| Previous Weekly Low | 0.6314 |
| Previous Monthly High | 0.6514 |
| Previous Monthly Low | 0.6230 |
| Daily Fibonacci 38.2% | 0.6397 |
| Daily Fibonacci 61.8% | 0.6418 |
| Daily Pivot Point S1 | 0.6359 |
| Daily Pivot Point S2 | 0.6319 |
| Daily Pivot Point S3 | 0.6274 |
| Daily Pivot Point R1 | 0.6444 |
| Daily Pivot Point R2 | 0.6489 |
| Daily Pivot Point R3 | 0.6529 |
[/s2If]
Join Our Telegram Group
")


