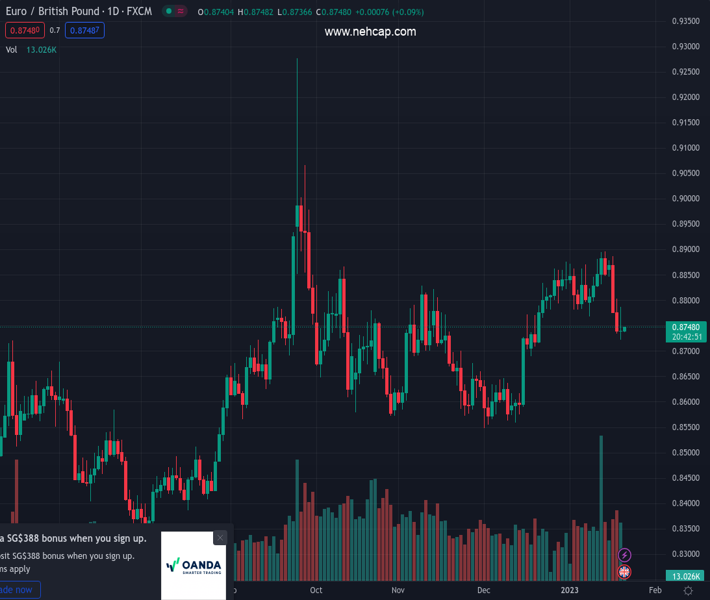
#EURGBP @ 0.87475 picks up bids to consolidate the biggest weekly loss in three months., @nehcap view: Bearish (Pivot Orderbook analysis)
…
This is a premium post.
[s2If !current_user_can(access_s2member_level4)]Please register for PREMIUM VERSION HERE to read full post below containing analysis. In case of any error or you think you are not able to read the full post below, please email us at support#nehcap.com [lwa][/s2If] [s2If current_user_can(access_s2member_level4)]
- EUR/GBP picks up bids to consolidate the biggest weekly loss in three months.
- Convergence of 50-DMA, 100-DMA put a strong floor under prices.
- Recovery remains elusive below one-month-old horizontal resistance, Bearish MACD signals keep sellers hopeful.
The pair currently trades last at 0.87475.
The previous day high was 0.8787 while the previous day low was 0.8722. The daily 38.2% Fib levels comes at 0.8747, expected to provide support. Similarly, the daily 61.8% fib level is at 0.8762, expected to provide resistance.
EUR/GBP licks its wounds near 0.8745 as it struggles to recover from the monthly low during early Friday. In doing so, the cross-currency pair consolidates the biggest weekly losses since late October ahead of a speech from the European Central Bank (ECB) President Christine Lagarde and the UK Retail Sales for December.
Technically, the EUR/GBP bounces off a convergence of the 50-DMA and the 100-DMA, around 0.8730 by the press time. Even so, bearish MACD signals favor the pair sellers.
That said, the quote’s latest rebound could gain the market’s attention if it manages to cross the one-month-old horizontal resistance, previous support near 0.8770.
Following that, a gradual run-up towards a 10-week-old ascending resistance line, close to 0.8910 by the press time, can’t be ruled out. However, the November 2022 high near 0.8830 could act as an intermediate halt during the anticipated advances.
Meanwhile, a daily closing below the 0.8730 support confluence could quickly drag the EUR/GBP price to the 0.8700 threshold.
However, an ascending support line from early August 2022, near 0.8630 at the latest, could challenge the pair sellers afterward.
It should be noted that the EUR/GBP weakness past 0.8630 won’t hesitate to challenge the previous monthly low near 0.8550.
Trend: Bearish
Technical Levels: Supports and Resistances
EURGBP currently trading at 0.8745 at the time of writing. Pair opened at 0.8742 and is trading with a change of 0.03% % .
| Overview | Overview.1 | |
|---|---|---|
| 0 | Today last price | 0.8745 |
| 1 | Today Daily Change | 0.0003 |
| 2 | Today Daily Change % | 0.03% |
| 3 | Today daily open | 0.8742 |
The pair is trading below its 20 Daily moving average @ 0.8824, above its 50 Daily moving average @ 0.8729 , above its 100 Daily moving average @ 0.8727 and above its 200 Daily moving average @ 0.8608
| Trends | Trends.1 | |
|---|---|---|
| 0 | Daily SMA20 | 0.8824 |
| 1 | Daily SMA50 | 0.8729 |
| 2 | Daily SMA100 | 0.8727 |
| 3 | Daily SMA200 | 0.8608 |
The previous day high was 0.8787 while the previous day low was 0.8722. The daily 38.2% Fib levels comes at 0.8747, expected to provide support. Similarly, the daily 61.8% fib level is at 0.8762, expected to provide resistance.
Note the levels of interest below:
- Pivot support is noted at 0.8714, 0.8685, 0.8648
- Pivot resistance is noted at 0.8779, 0.8816, 0.8844
| Levels | Levels.1 |
|---|---|
| Previous Daily High | 0.8787 |
| Previous Daily Low | 0.8722 |
| Previous Weekly High | 0.8897 |
| Previous Weekly Low | 0.8769 |
| Previous Monthly High | 0.8877 |
| Previous Monthly Low | 0.8547 |
| Daily Fibonacci 38.2% | 0.8747 |
| Daily Fibonacci 61.8% | 0.8762 |
| Daily Pivot Point S1 | 0.8714 |
| Daily Pivot Point S2 | 0.8685 |
| Daily Pivot Point S3 | 0.8648 |
| Daily Pivot Point R1 | 0.8779 |
| Daily Pivot Point R2 | 0.8816 |
| Daily Pivot Point R3 | 0.8844 |
[/s2If]
Join Our Telegram Group
")


