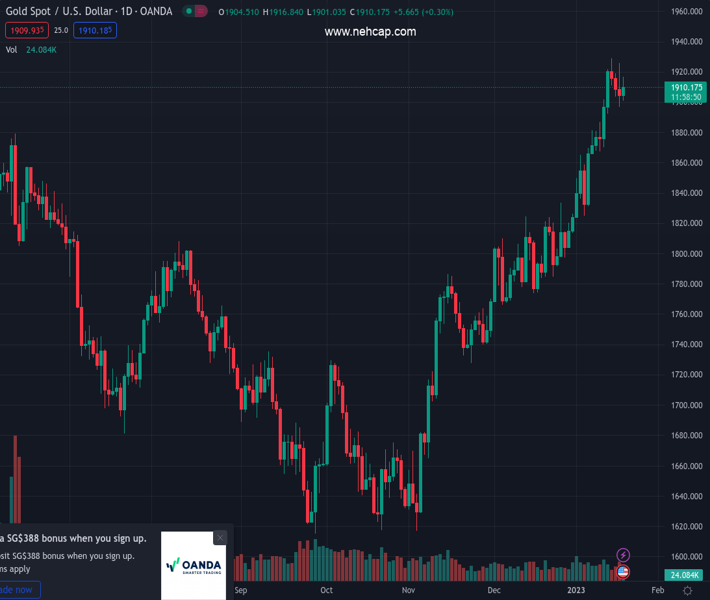
#XAUUSD @ 1,910.81 Gold price regains positive traction on Thursday and snaps a three-day losing streak. (Pivot Orderbook analysis)
…
This is a premium post.
[s2If !current_user_can(access_s2member_level4)]Please register for PREMIUM VERSION HERE to read full post below containing analysis. In case of any error or you think you are not able to read the full post below, please email us at support#nehcap.com [lwa][/s2If] [s2If current_user_can(access_s2member_level4)]
- Gold price regains positive traction on Thursday and snaps a three-day losing streak.
- Recession fears, rising bets for smaller Fed rate hikes, softer US Dollar lend support.
- The fundamental backdrop favours bulls and supports prospects for additional gains.
The pair currently trades last at 1910.81.
The previous day high was 1925.95 while the previous day low was 1896.63. The daily 38.2% Fib levels comes at 1907.83, expected to provide support. Similarly, the daily 61.8% fib level is at 1914.75, expected to provide resistance.
Gold price attracts some buyers near the $1,900 mark on Thursday and stalls a three-day-old downtrend from its highest level since April 25. The intraday uptick pushes the XAU/USD to a fresh daily peak, around the $1,916-$1,917 region, during the first half of the European session and is sponsored by a combination of factors.
The prevalent risk-off environment – as depicted by the ongoing decline in the equity markets – is seen benefiting the safe-haven Gold price. The weaker-than-expected economic data released from the United States (US) on Wednesday fueled concerns about a broader slowdown in the country. Furthermore, worries about the economic headwinds stemming from the worst yet COVID-19 outbreak in China sparks recession fears and tempers investors’ appetite for riskier assets.
The global flight to safety, along with firming expectations for a less aggressive policy tightening by the Federal Reserve (Fed), continue to exert downward pressure on the US Treasury bond yields. In fact, the yield on the rate-sensitive two-year US government bond drops to its lowest level since October amid rising bets for a smaller 25 bps Fed rate hike in February. This, in turn, keeps the US Dollar (USD) bulls on the defensive and underpins the non-yielding Gold price.
In fact, the USD Index, which tracks the greenback’s performance against a basket of currencies, hangs near a multi-month low amid growing acceptance that the US central bank will soften its hawkish stance. That said, several Fed officials indicated on Wednesday that they will push on with more rate hikes even as inflation shows signs of easing and economic activity is slowing. This helps limit losses for the buck and acts as a headwind for the US Dollar-denominated Gold price.
Nevertheless, the fundamental backdrop remains tilted firmly in favour of bullish traders and supports prospects for further gains in Gold price. Hence, any corrective pullback could be seen as a buying opportunity and is likely to remain limited. Traders now look to the US economic docket, featuring the Philly Fed Manufacturing Index, the usual Weekly Initial Jobless Claims and housing market data. This, along with Fedspeaks and the US bond yields, should provide some impetus to the XAU/USD.
From a technical perspective, any subsequent move up might continue to confront resistance near the $1,927-$1,929 region ahead of the next relevant hurdle is seen near the $1,942 zone. Some follow-through buying will be seen as a fresh trigger for bullish traders and set the stage for an extension of the recent uptrend witnessed over the past two months or so. On the flip side, the $1,900-$1,895 area is likely to protect the immediate downside ahead of the $1,882-$1,880 region. A convincing break below the latter might negate the positive outlook and shift the near-term bias in favour of bearish traders.
Technical Levels: Supports and Resistances
XAUUSD currently trading at 1910.33 at the time of writing. Pair opened at 1903.47 and is trading with a change of 0.36 % .
| Overview | Overview.1 | |
|---|---|---|
| 0 | Today last price | 1910.33 |
| 1 | Today Daily Change | 6.86 |
| 2 | Today Daily Change % | 0.36 |
| 3 | Today daily open | 1903.47 |
The pair remains strongly bullish on the daily timeframe. It trades above its 20 SMA @ 1851.62, 50 SMA 1805.76, 100 SMA @ 1739.63 and 200 SMA @ 1776.42.
| Trends | Trends.1 | |
|---|---|---|
| 0 | Daily SMA20 | 1851.62 |
| 1 | Daily SMA50 | 1805.76 |
| 2 | Daily SMA100 | 1739.63 |
| 3 | Daily SMA200 | 1776.42 |
The previous day high was 1925.95 while the previous day low was 1896.63. The daily 38.2% Fib levels comes at 1907.83, expected to provide support. Similarly, the daily 61.8% fib level is at 1914.75, expected to provide resistance.
Note the levels of interest below:
- Pivot support is noted at 1891.42, 1879.36, 1862.1
- Pivot resistance is noted at 1920.74, 1938.0, 1950.06
| Levels | Levels.1 |
|---|---|
| Previous Daily High | 1925.95 |
| Previous Daily Low | 1896.63 |
| Previous Weekly High | 1921.96 |
| Previous Weekly Low | 1865.22 |
| Previous Monthly High | 1833.38 |
| Previous Monthly Low | 1765.89 |
| Daily Fibonacci 38.2% | 1907.83 |
| Daily Fibonacci 61.8% | 1914.75 |
| Daily Pivot Point S1 | 1891.42 |
| Daily Pivot Point S2 | 1879.36 |
| Daily Pivot Point S3 | 1862.10 |
| Daily Pivot Point R1 | 1920.74 |
| Daily Pivot Point R2 | 1938.00 |
| Daily Pivot Point R3 | 1950.06 |
[/s2If]
Join Our Telegram Group
")


