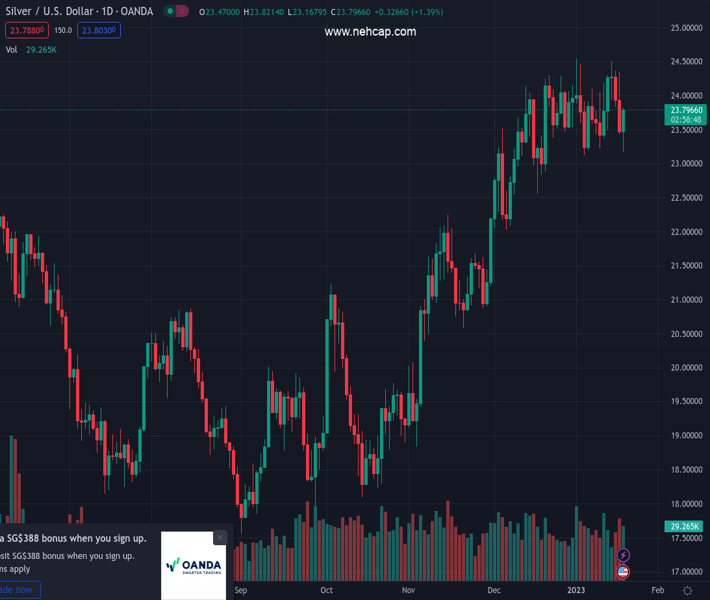
#XAGUSD @ 23.806 Silver’s bounced off daily lows nearby the $23.00 figure and is climbing sharply, gaining 1.33%. (Pivot Orderbook analysis)
…
This is a premium post.
[s2If !current_user_can(access_s2member_level4)]Please register for PREMIUM VERSION HERE to read full post below containing analysis. In case of any error or you think you are not able to read the full post below, please email us at support#nehcap.com [lwa][/s2If] [s2If current_user_can(access_s2member_level4)]
- Silver’s bounced off daily lows nearby the $23.00 figure and is climbing sharply, gaining 1.33%.
- US Dollar continued to weaken, but US Treasury bond yields put a lid on XAG/USD’s rally.
- XAG/USD is exposed to selling pressure below $23.60; otherwise, it could re-test the YTD high.
The pair currently trades last at 23.806.
The previous day high was 24.35 while the previous day low was 23.42. The daily 38.2% Fib levels comes at 23.78, expected to provide support. Similarly, the daily 61.8% fib level is at 23.99, expected to provide resistance.
Silver price is trimming some of Wednesday’s losses and probes the 20-day Exponential Moving Average (EMA) around $23.65 on a trading session characterized by a weaker US Dollar (USD) and a downbeat market mood spurred by recession fears after dismal US data. Therefore, the XAG/USD is trading at $23.74 after hitting a daily low of $23.17.
Silver’s daily chart suggests the white metal could peak around the $24.50s area. The non-yielding metal hasn’t been able to crack the latter, keeping Silver bears hopeful. As XAG/USD has reached higher peaks, the Relative Strength Index (RSI) did not, opening the door for a negative divergence. In addition, the Rate of Change (RoC) in the last two days suggests bearish momentum increased. Hence, a pullback in XAG/USD is on the cards.
For that scenario to play out, the XAG/USD needs to drop below $23.17, so the $23.00 psychological level could be exposed. A breach of the latter will open the door to test the 50-day EMA at $22.87, which, once cleared, will send XAG/USD dropping toward the December 16 low of $22.56.
As an alternate scenario, if Silver reclaims and achieves a daily close above the 20-day EMA, that could pave the way for a re-test of the YTD high of $24.54. Firstly, reclaiming the former would expose the $24.00 handle. The break above will reveal the YTD high at $24.54.
Technical Levels: Supports and Resistances
XAGUSD currently trading at 23.75 at the time of writing. Pair opened at 23.45 and is trading with a change of 1.28 % .
| Overview | Overview.1 | |
|---|---|---|
| 0 | Today last price | 23.75 |
| 1 | Today Daily Change | 0.30 |
| 2 | Today Daily Change % | 1.28 |
| 3 | Today daily open | 23.45 |
The pair is trading below its 20 Daily moving average @ 23.78, above its 50 Daily moving average @ 22.89 , above its 100 Daily moving average @ 21.11 and above its 200 Daily moving average @ 21.06
| Trends | Trends.1 | |
|---|---|---|
| 0 | Daily SMA20 | 23.78 |
| 1 | Daily SMA50 | 22.89 |
| 2 | Daily SMA100 | 21.11 |
| 3 | Daily SMA200 | 21.06 |
The previous day high was 24.35 while the previous day low was 23.42. The daily 38.2% Fib levels comes at 23.78, expected to provide support. Similarly, the daily 61.8% fib level is at 23.99, expected to provide resistance.
Note the levels of interest below:
- Pivot support is noted at 23.14, 22.82, 22.21
- Pivot resistance is noted at 24.06, 24.66, 24.98
| Levels | Levels.1 |
|---|---|
| Previous Daily High | 24.35 |
| Previous Daily Low | 23.42 |
| Previous Weekly High | 24.30 |
| Previous Weekly Low | 23.22 |
| Previous Monthly High | 24.30 |
| Previous Monthly Low | 22.03 |
| Daily Fibonacci 38.2% | 23.78 |
| Daily Fibonacci 61.8% | 23.99 |
| Daily Pivot Point S1 | 23.14 |
| Daily Pivot Point S2 | 22.82 |
| Daily Pivot Point S3 | 22.21 |
| Daily Pivot Point R1 | 24.06 |
| Daily Pivot Point R2 | 24.66 |
| Daily Pivot Point R3 | 24.98 |
[/s2If]
Join Our Telegram Group
")


