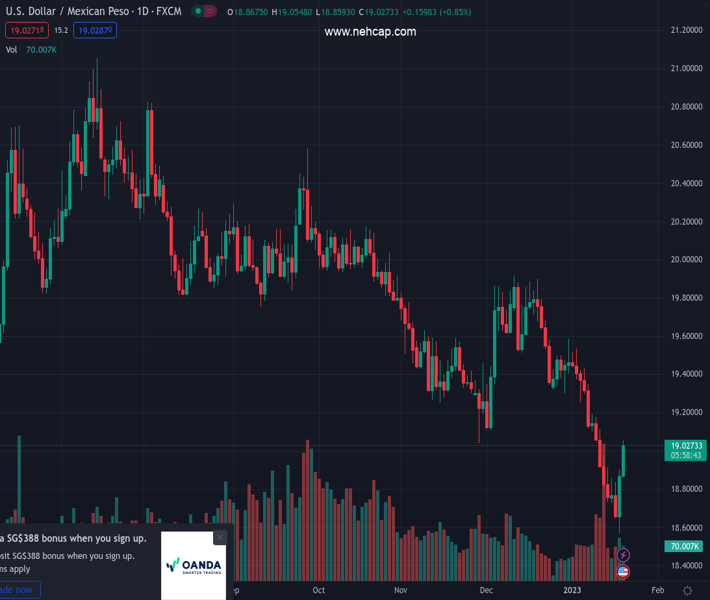
#USDMXN @ 19.0321 Mexican Peso remains under pressure versus the US Dollar (Pivot Orderbook analysis)
…
This is a premium post.
[s2If !current_user_can(access_s2member_level4)]Please register for PREMIUM VERSION HERE to read full post below containing analysis. In case of any error or you think you are not able to read the full post below, please email us at support#nehcap.com [lwa][/s2If] [s2If current_user_can(access_s2member_level4)]
- Mexican Peso remains under pressure versus the US Dollar
- USD/MXN tests levels above 19.00, up 2.5% from Wednesday’s low.
The pair currently trades last at 19.0321.
The previous day high was 18.8994 while the previous day low was 18.5663. The daily 38.2% Fib levels comes at 18.7722, expected to provide support. Similarly, the daily 61.8% fib level is at 18.6935, expected to provide support.
The USD/MXN is trading slightly above 19.00, looking at the weekly high it hit earlier on Thursday at 19.05. The pair resume the upside after a brief pullback to 18.89. On Wednesday, it traded as low as 18.56, the lowest since February 2020.
The Mexican Peso has been unable to benefit from the rebound in commodity prices. At the same time, the US Dollar remains firm supported by economic data and higher US yields.
Economic data released on Thursday in the US came in above expectations (Initial Jobless Claims and Philly Fed) and helped market sentiment. Still, Wall Street’s indexes are in red. Emerging market currencies remain under pressure, extending the correction from multi-day highs. The rebound in commodity prices on Thursday is being offset by higher US yields.
The US hit the debt limit and the Treasury started to implement special measures to avoid a default. The debate on raising the debt ceiling at Congress is set to be complex as Republicans hold the House and Democrats the Senate.
In Mexico, Congress voted to confirm Omar Mejía, the government’s nominee for the Bank of Mexico for an eight-year period. Relatively unknown to market participants prior to his nomination, Mejía’s first vote at the board will be at the next meeting February 9. He backed the current interest rate hike cycle and promised transparency and independence.
The USD/MXN is staging a solid rebound. Technical indicators are turning to the upside in the daily chart. Price still remains below the 20-day Simple Moving Average that awaits at 19.17. If the pair manages to break and hold above 19.00/05, the next strong barrier emerges at 19.30.
A slide back to 18.80 would be seen as a normal correction to the recent rally. If it drops below, the Mexican Peso would recover some strength.
Technical Levels: Supports and Resistances
USDMXN currently trading at 18.977 at the time of writing. Pair opened at 18.8934 and is trading with a change of 0.44 % .
| Overview | Overview.1 | |
|---|---|---|
| 0 | Today last price | 18.9770 |
| 1 | Today Daily Change | 0.0836 |
| 2 | Today Daily Change % | 0.4400 |
| 3 | Today daily open | 18.8934 |
The pair remains strongly bearish on the daily time frame. It trades below the 20 SMA @ 19.2002, 50 SMA 19.3902, 100 SMA @ 19.6763 and 200 SMA @ 19.9209.
| Trends | Trends.1 | |
|---|---|---|
| 0 | Daily SMA20 | 19.2002 |
| 1 | Daily SMA50 | 19.3902 |
| 2 | Daily SMA100 | 19.6763 |
| 3 | Daily SMA200 | 19.9209 |
The previous day high was 18.8994 while the previous day low was 18.5663. The daily 38.2% Fib levels comes at 18.7722, expected to provide support. Similarly, the daily 61.8% fib level is at 18.6935, expected to provide support.
Note the levels of interest below:
- Pivot support is noted at 18.6733, 18.4532, 18.3402
- Pivot resistance is noted at 19.0065, 19.1195, 19.3396
| Levels | Levels.1 |
|---|---|
| Previous Daily High | 18.8994 |
| Previous Daily Low | 18.5663 |
| Previous Weekly High | 19.1951 |
| Previous Weekly Low | 18.7331 |
| Previous Monthly High | 19.9181 |
| Previous Monthly Low | 19.1084 |
| Daily Fibonacci 38.2% | 18.7722 |
| Daily Fibonacci 61.8% | 18.6935 |
| Daily Pivot Point S1 | 18.6733 |
| Daily Pivot Point S2 | 18.4532 |
| Daily Pivot Point S3 | 18.3402 |
| Daily Pivot Point R1 | 19.0065 |
| Daily Pivot Point R2 | 19.1195 |
| Daily Pivot Point R3 | 19.3396 |
[/s2If]
Join Our Telegram Group
")


