NZDUSD @ 0.62568 – Trading Levels analysis: sticks to gains near daily high, above mid-0.6200s amid softer USD
…
This is a premium post.
[s2If !current_user_can(access_s2member_level4)]Please register for PREMIUM VERSION HERE and login below to read further [lwa][/s2If] [s2If current_user_can(access_s2member_level4)]
- A combination of factors assists NZD/USD to catch fresh bids on the first day of a new week.
- Retreating US bond yields undermines the USD and offers support amid a positive risk tone.
- Recession fears, larger Fed rate hike bets could limit the USD losses and cap gains for the pair.
The pair currently trades last at 0.62568.
The previous day high was 0.6308 while the previous day low was 0.6212. The daily 38.2% Fib levels comes at 0.6249, expected to provide support. Similarly, the daily 61.8% fib level is at 0.6271, expected to provide resistance.
The NZD/USD pair regains positive traction on the first day of a new week and recovers a major part of Friday’s decline to the 0.6215-0.6210 support zone. The intraday buying picks up pace during the early European session and lifts spot prices to the 0.6270 area, or a fresh daily high in the last hour.
The US dollar struggles to capitalize on its post-NFP strong move up and meets with a fresh supply on Monday, which, in turn, offers some support to the NZD/USD pair. A fresh leg down in the US Treasury bond yields keeps the USD bulls on the defensive. Apart from this, a generally positive tone around the equity markets further undermines the safe-haven buck and benefits the risk-sensitive kiwi.
That said, growing worries about a global economic downturn and the US-China tension over Taiwan should keep a lid on any optimistic move in the markets. Furthermore, renewed speculations for a more aggressive policy tightening by the Fed should act as a tailwind for the US bond yields. This supports prospects for the emergence of some USD dip-buying and should cap the NZD/USD pair.
The US monthly jobs report released on Friday showed that the economy added 528K jobs in July, smashing consensus estimates by a big margin. Furthermore, the unemployment rate unexpectedly edged lower to 3.5% from the 3.6% in the previous month. Moreover, Average Hourly Earnings also beat expectations and rose 0.5% MoM in July. The data pointed to a further rise in inflationary pressures and lifted bets for a 75 bps Fed rate hike move at the next policy meeting in September.
Hence, the market focus now shifts to the release of the latest US consumer inflation figures, due on Wednesday. The US CPI report would influence Fed rate hike expectations and play a key role in driving the near-term USD demand, which, in turn, should help determine the next leg of a directional move for the NZD/USD pair. In the meantime, the USD remains at the mercy of the US bond yields, which, along with the broader risk sentiment, might provide some impetus to the major.
Technical Levels: Supports and Resistances
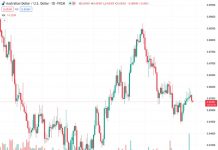
NZDUSD currently trading at 0.626 at the time of writing. Pair opened at 0.6238 and is trading with a change of 0.35 % .
| Overview | Overview.1 | |
|---|---|---|
| 0 | Today last price | 0.6260 |
| 1 | Today Daily Change | 0.0022 |
| 2 | Today Daily Change % | 0.3500 |
| 3 | Today daily open | 0.6238 |
The pair is trading above its 20 Daily moving average @ 0.6223, below its 50 Daily moving average @ 0.6287 , below its 100 Daily moving average @ 0.647 and below its 200 Daily moving average @ 0.6642
| Trends | Trends.1 | |
|---|---|---|
| 0 | Daily SMA20 | 0.6223 |
| 1 | Daily SMA50 | 0.6287 |
| 2 | Daily SMA100 | 0.6470 |
| 3 | Daily SMA200 | 0.6642 |
The previous day high was 0.6308 while the previous day low was 0.6212. The daily 38.2% Fib levels comes at 0.6249, expected to provide support. Similarly, the daily 61.8% fib level is at 0.6271, expected to provide resistance.
Note the levels of interest below:
- Pivot support is noted at 0.6197, 0.6157, 0.6101
- Pivot resistance is noted at 0.6293, 0.6349, 0.6389
| Levels | Levels.1 |
|---|---|
| Previous Daily High | 0.6308 |
| Previous Daily Low | 0.6212 |
| Previous Weekly High | 0.6353 |
| Previous Weekly Low | 0.6212 |
| Previous Monthly High | 0.6330 |
| Previous Monthly Low | 0.6061 |
| Daily Fibonacci 38.2% | 0.6249 |
| Daily Fibonacci 61.8% | 0.6271 |
| Daily Pivot Point S1 | 0.6197 |
| Daily Pivot Point S2 | 0.6157 |
| Daily Pivot Point S3 | 0.6101 |
| Daily Pivot Point R1 | 0.6293 |
| Daily Pivot Point R2 | 0.6349 |
| Daily Pivot Point R3 | 0.6389 |
[/s2If]