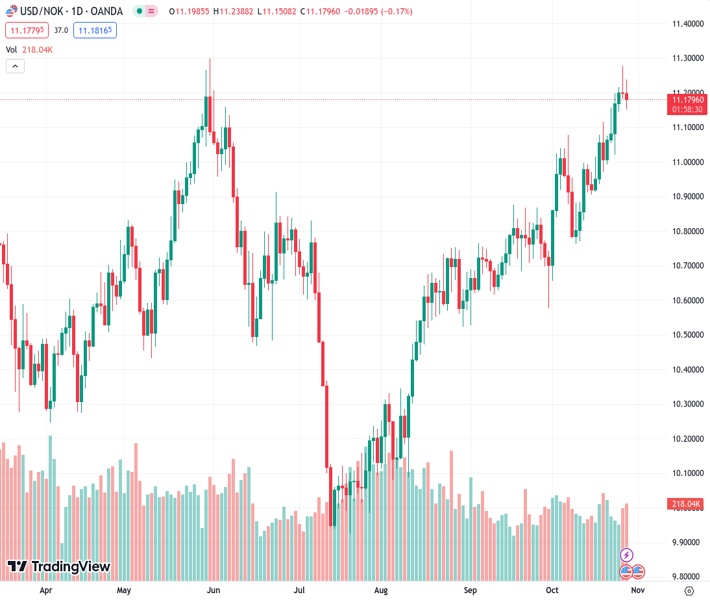
#USDNOK @ 11.17840 struck a high since late May on Thursday of 11.276.
…
This is a premium post.
[s2If !current_user_can(access_s2member_level4)]Please register for FREE REGISTER to read full post below containing analysis. In case of any error or you think you are not able to read the full post below, please email us at support#nehcap.com [lwa][/s2If] [s2If current_user_can(access_s2member_level1)]
- USD/NOK struck a high since late May on Thursday of 11.276.
The pair currently trades last at 11.17840.
The previous day high was 11.277 while the previous day low was 11.182. The daily 38.2% Fib levels comes at 11.2407, expected to provide resistance. Similarly, the daily 61.8% fib level is at 11.2183, expected to provide resistance.
In Friday’s session, the USD/NOK trades with losses, mainly driven by investors taking profits after the pair jumped to its highest level since May 31 on Thursday. Contributing to the downward trajectory, the US Dollar is trading weak after the September Core Personal Consumption Expenditures was reported to have decelerated as expected.
In line with that, the U.S. Bureau of Economic Analysis reported that the Core PCE Price Index from September aligned with the consensus. It came in at 3.7% YoY vs the expected 3.7% but fell in relation to it last reading of 3.8%. As a reaction, the 2-year rate stands at 5.03% while the 5 and 10-year yields are seen at 4.79% and 4.85%, respectively, with little movement.
It is worth noticing that higher US Treasury yields drove the recent NOK’s weakness, and as the rates retreat from multi-year highs, it limits the upward momentum from the pair. In addition, hawkish bets on the Federal Reserve (Fed) remain subdued, which could also pause the pair’s gains. That being said, the Fed meets next week, and investors will look for clues in the monetary policy statement and in Chair Powell’s press conference to continue betting on the next decisions. A pause for next week is practically priced in, but some market participants still forecast some odds of the Fed hiking by 25 bps in December, but those expectations may rise or fall based on the bank’s and Powell’s stance.
The daily chart highlights a neutral to bullish technical outlook for USD/NOK as signs of exhaustion of the buying momentum become evident. The Relative Strength Index (RSI) displays a negative slope but is still in bullish territory, while the Moving Average Convergence (MACD) presents neutral green bars. However, the pair is above the 20,100,200-day Simple Moving Average (SMA), indicating a favorable position for the bulls in the bigger picture.
Support levels: 11.155, 11.083, 11.023 (20-day SMA),
Resistance levels: 11.200, 11.235, 11.276.
Technical Levels: Supports and Resistances
USDNOK currently trading at 11.1823 at the time of writing. Pair opened at 11.2024 and is trading with a change of -0.18 % .
| Overview | Overview.1 | |
|---|---|---|
| 0 | Today last price | 11.1823 |
| 1 | Today Daily Change | -0.0201 |
| 2 | Today Daily Change % | -0.1800 |
| 3 | Today daily open | 11.2024 |
The pair remains strongly bullish on the daily timeframe. It trades above its 20 SMA @ 10.9693, 50 SMA 10.8104, 100 SMA @ 10.6172 and 200 SMA @ 10.5641.
| Trends | Trends.1 | |
|---|---|---|
| 0 | Daily SMA20 | 10.9693 |
| 1 | Daily SMA50 | 10.8104 |
| 2 | Daily SMA100 | 10.6172 |
| 3 | Daily SMA200 | 10.5641 |
The previous day high was 11.277 while the previous day low was 11.182. The daily 38.2% Fib levels comes at 11.2407, expected to provide resistance. Similarly, the daily 61.8% fib level is at 11.2183, expected to provide resistance.
Note the levels of interest below:
- Pivot support is noted at 11.164, 11.1255, 11.069
- Pivot resistance is noted at 11.259, 11.3155, 11.3539
| Levels | Levels.1 |
|---|---|
| Previous Daily High | 11.2770 |
| Previous Daily Low | 11.1820 |
| Previous Weekly High | 11.1145 |
| Previous Weekly Low | 10.9048 |
| Previous Monthly High | 10.8758 |
| Previous Monthly Low | 10.5261 |
| Daily Fibonacci 38.2% | 11.2407 |
| Daily Fibonacci 61.8% | 11.2183 |
| Daily Pivot Point S1 | 11.1640 |
| Daily Pivot Point S2 | 11.1255 |
| Daily Pivot Point S3 | 11.0690 |
| Daily Pivot Point R1 | 11.2590 |
| Daily Pivot Point R2 | 11.3155 |
| Daily Pivot Point R3 | 11.3539 |
[/s2If]
Download Nehcap EAWe have two EAs that are operational on our LIVE accounts.
- EA-FIX: Check out the details here. Download EA-FIX . EA-FIX is a non-grid HFT scalper.
- EA-GROWTH: High quality low dd EA using trend grids. Download EA_GROWTHJoin Our Telegram Group
")


