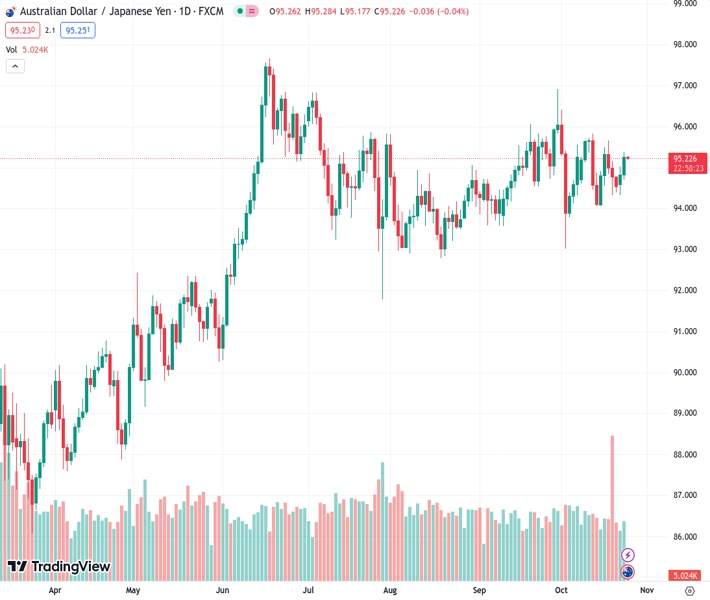
#AUDJPY @ 95.2330 reaches a new four-day high at 95.37, trading at 95.22 as the Asian session begins.
…
This is a premium post.
[s2If !current_user_can(access_s2member_level4)]Please register for FREE REGISTER to read full post below containing analysis. In case of any error or you think you are not able to read the full post below, please email us at support#nehcap.com [lwa][/s2If] [s2If current_user_can(access_s2member_level1)]
- AUD/JPY reaches a new four-day high at 95.37, trading at 95.22 as the Asian session begins.
The pair currently trades last at 95.2330.
The previous day high was 95.02 while the previous day low was 94.32. The daily 38.2% Fib levels comes at 94.75, expected to provide support. Similarly, the daily 61.8% fib level is at 94.59, expected to provide support.
The AUD/JPY reached a new four-day high at 95.37 on Tuesday, registering solid gains of 0.46%. However, as Wednesday’s Asian session begins, the cross-pair exchanges hands at 95..22, down a minimal 0.04%.
The daily chart portrays the pair as neutral-biased, tilted to the upside due to remaining above the Ichimoku Cloud (Kumo), which has narrowed, as the AUD/JPY is trendless. For a bullish continuation, buyers must reclaim the October 12 high at 95.83, followed by the latest cycle high at 96.92.
On the flip side, AUD/JPY sellers would need to clear the 94.96/85 area, where the Kijun and Tenkan-Sen levels lie, followed by the top of the Kumo at 94.65. A breach of the latter and the cross would slip inside the cloud, with the following support seen at the bottom of the Kumo at 94.00, followed by the October 3 low of 93.01.
Technical Levels: Supports and Resistances
AUDJPY currently trading at 95.26 at the time of writing. Pair opened at 94.86 and is trading with a change of 0.42 % .
| Overview | Overview.1 | |
|---|---|---|
| 0 | Today last price | 95.26 |
| 1 | Today Daily Change | 0.40 |
| 2 | Today Daily Change % | 0.42 |
| 3 | Today daily open | 94.86 |
The pair remains strongly bullish on the daily timeframe. It trades above its 20 SMA @ 95.04, 50 SMA 94.66, 100 SMA @ 94.81 and 200 SMA @ 92.65.
| Trends | Trends.1 | |
|---|---|---|
| 0 | Daily SMA20 | 95.04 |
| 1 | Daily SMA50 | 94.66 |
| 2 | Daily SMA100 | 94.81 |
| 3 | Daily SMA200 | 92.65 |
The previous day high was 95.02 while the previous day low was 94.32. The daily 38.2% Fib levels comes at 94.75, expected to provide support. Similarly, the daily 61.8% fib level is at 94.59, expected to provide support.
Note the levels of interest below:
- Pivot support is noted at 94.44, 94.03, 93.74
- Pivot resistance is noted at 95.15, 95.44, 95.85
| Levels | Levels.1 |
|---|---|
| Previous Daily High | 95.02 |
| Previous Daily Low | 94.32 |
| Previous Weekly High | 95.66 |
| Previous Weekly Low | 94.14 |
| Previous Monthly High | 96.92 |
| Previous Monthly Low | 93.59 |
| Daily Fibonacci 38.2% | 94.75 |
| Daily Fibonacci 61.8% | 94.59 |
| Daily Pivot Point S1 | 94.44 |
| Daily Pivot Point S2 | 94.03 |
| Daily Pivot Point S3 | 93.74 |
| Daily Pivot Point R1 | 95.15 |
| Daily Pivot Point R2 | 95.44 |
| Daily Pivot Point R3 | 95.85 |
[/s2If]
Download Nehcap EAWe have two EAs that are operational on our LIVE accounts.
- EA-FIX: Check out the details here. Download EA-FIX . EA-FIX is a non-grid HFT scalper.
- EA-GROWTH: High quality low dd EA using trend grids. Download EA_GROWTHJoin Our Telegram Group
")


