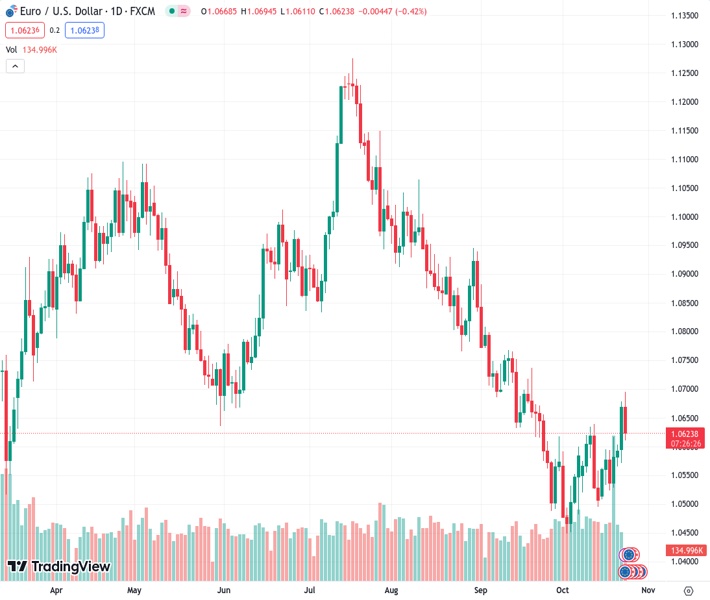
#EURUSD @ 1.06212 abandons the area of monthly highs near 1.0700.
…
This is a premium post.
[s2If !current_user_can(access_s2member_level4)]Please register for FREE REGISTER to read full post below containing analysis. In case of any error or you think you are not able to read the full post below, please email us at support#nehcap.com [lwa][/s2If] [s2If current_user_can(access_s2member_level1)]
- EUR/USD abandons the area of monthly highs near 1.0700.
The pair currently trades last at 1.06212.
The previous day high was 1.0678 while the previous day low was 1.0572. The daily 38.2% Fib levels comes at 1.0637, expected to provide resistance. Similarly, the daily 61.8% fib level is at 1.0612, expected to provide support.
EUR/USD sparked a meaningful corrective decline after hitting monthly highs just below the 1.0700 barrier earlier on Tuesday.
In case bulls regain the upper hand, the pair is expected to dispute the October high at 1.0694 (October 12), which is propped up by the transitory 55-day SMA at 1.0702 and comes ahead of the weekly peak at 1.0736 (September 20).
Meanwhile, further losses remain on the table as long as the pair navigates the area below the key 200-day SMA at 1.0816.
Technical Levels: Supports and Resistances
EURUSD currently trading at 1.0613 at the time of writing. Pair opened at 1.067 and is trading with a change of -0.53 % .
| Overview | Overview.1 | |
|---|---|---|
| 0 | Today last price | 1.0613 |
| 1 | Today Daily Change | 83.0000 |
| 2 | Today Daily Change % | -0.5300 |
| 3 | Today daily open | 1.0670 |
The pair is trading above its 20 Daily moving average @ 1.0557, below its 50 Daily moving average @ 1.0685 , below its 100 Daily moving average @ 1.0825 and below its 200 Daily moving average @ 1.0819
| Trends | Trends.1 | |
|---|---|---|
| 0 | Daily SMA20 | 1.0557 |
| 1 | Daily SMA50 | 1.0685 |
| 2 | Daily SMA100 | 1.0825 |
| 3 | Daily SMA200 | 1.0819 |
The previous day high was 1.0678 while the previous day low was 1.0572. The daily 38.2% Fib levels comes at 1.0637, expected to provide resistance. Similarly, the daily 61.8% fib level is at 1.0612, expected to provide support.
Note the levels of interest below:
- Pivot support is noted at 1.0602, 1.0533, 1.0495
- Pivot resistance is noted at 1.0708, 1.0746, 1.0815
| Levels | Levels.1 |
|---|---|
| Previous Daily High | 1.0678 |
| Previous Daily Low | 1.0572 |
| Previous Weekly High | 1.0617 |
| Previous Weekly Low | 1.0511 |
| Previous Monthly High | 1.0882 |
| Previous Monthly Low | 1.0488 |
| Daily Fibonacci 38.2% | 1.0637 |
| Daily Fibonacci 61.8% | 1.0612 |
| Daily Pivot Point S1 | 1.0602 |
| Daily Pivot Point S2 | 1.0533 |
| Daily Pivot Point S3 | 1.0495 |
| Daily Pivot Point R1 | 1.0708 |
| Daily Pivot Point R2 | 1.0746 |
| Daily Pivot Point R3 | 1.0815 |
[/s2If]
Download Nehcap EAWe have two EAs that are operational on our LIVE accounts.
- EA-FIX: Check out the details here. Download EA-FIX . EA-FIX is a non-grid HFT scalper.
- EA-GROWTH: High quality low dd EA using trend grids. Download EA_GROWTHJoin Our Telegram Group
")


