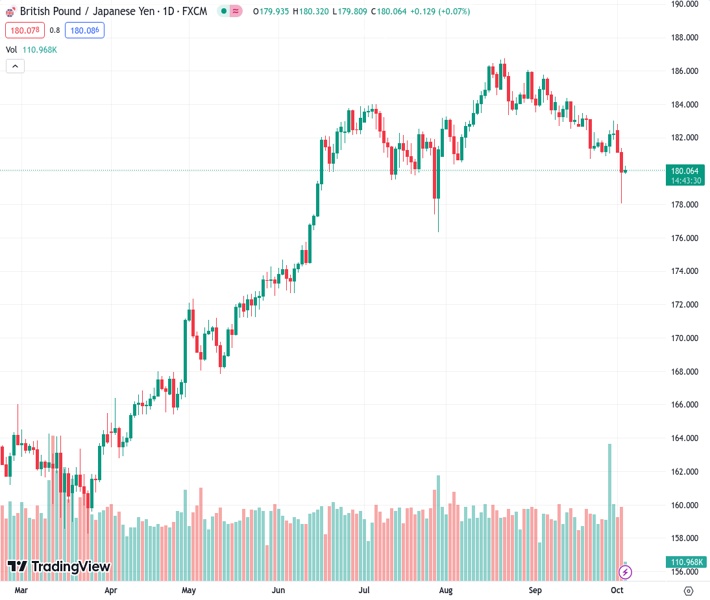
#GBPJPY @ 180.093 holds above the 180.00 area amid the fear of FX intervention by Japanese authorities.
…
This is a premium post.
[s2If !current_user_can(access_s2member_level4)]Please register for FREE REGISTER to read full post below containing analysis. In case of any error or you think you are not able to read the full post below, please email us at support#nehcap.com [lwa][/s2If] [s2If current_user_can(access_s2member_level1)]
- GBP/JPY holds above the 180.00 area amid the fear of FX intervention by Japanese authorities.
The pair currently trades last at 180.093.
The previous day high was 181.38 while the previous day low was 178.08. The daily 38.2% Fib levels comes at 179.34, expected to provide support. Similarly, the daily 61.8% fib level is at 180.12, expected to provide resistance.
The GBP/JPY cross manages to find support above the 180.00 level during the early European session on Wednesday. The downtick of the pair is supported by the fear of FX intervention by Japanese authorities. The cross currently trades around 180.13, gaining 0.09% on the day.
Early Wednesday, Japan’s top currency diplomat Masato Kanda said any intervention would not target forex levels but volatility while mentioning that it’s normal for authorities not to comment on whether they intervened or not. Additionally, Japan’s Chief Cabinet Secretary Hirokazu Matsuno said on Monday that he will continue to take appropriate steps on FX, but still have no comment on whether Japan intervened in the FX market.
From the technical perspective, the GBP/JPY cross holds below the 50- and 100-hour Exponential Moving Averages (EMAs) with a downward slope on the four-hour chart, highlighting the path of least resistance for the cross is to the downside.
The first resistance level of GBP/JPY is seen near the 50-hour EMA at 181.58. The additional upside filter to watch is at 182.17 (the 100-hour EMA). Further north, the next stop is located near the upper boundary of the Bollinger Band at 183.42. Any follow-through buying above the latter will see a rally to a high of September 15 at 183.90.
On the downside, 180.00 acts as an initial support level for the cross. Any decisive break below the latter will see a drop to the lower limit of the Bollinger Band at 179.43, en route to 178.85 (a low of June 16).
It’s worth noting that the Relative Strength Index (RSI) is located in bearish territory below 50, highlighting that further downside cannot be ruled out.
Technical Levels: Supports and Resistances
GBPJPY currently trading at 180.21 at the time of writing. Pair opened at 179.97 and is trading with a change of 0.13 % .
| Overview | Overview.1 | |
|---|---|---|
| 0 | Today last price | 180.21 |
| 1 | Today Daily Change | 0.24 |
| 2 | Today Daily Change % | 0.13 |
| 3 | Today daily open | 179.97 |
The pair is trading below its 20 Daily moving average @ 182.62, below its 50 Daily moving average @ 183.29 , below its 100 Daily moving average @ 180.88 and above its 200 Daily moving average @ 171.95
| Trends | Trends.1 | |
|---|---|---|
| 0 | Daily SMA20 | 182.62 |
| 1 | Daily SMA50 | 183.29 |
| 2 | Daily SMA100 | 180.88 |
| 3 | Daily SMA200 | 171.95 |
The previous day high was 181.38 while the previous day low was 178.08. The daily 38.2% Fib levels comes at 179.34, expected to provide support. Similarly, the daily 61.8% fib level is at 180.12, expected to provide resistance.
Note the levels of interest below:
- Pivot support is noted at 178.24, 176.52, 174.95
- Pivot resistance is noted at 181.54, 183.1, 184.83
| Levels | Levels.1 |
|---|---|
| Previous Daily High | 181.38 |
| Previous Daily Low | 178.08 |
| Previous Weekly High | 183.03 |
| Previous Weekly Low | 180.89 |
| Previous Monthly High | 185.78 |
| Previous Monthly Low | 180.82 |
| Daily Fibonacci 38.2% | 179.34 |
| Daily Fibonacci 61.8% | 180.12 |
| Daily Pivot Point S1 | 178.24 |
| Daily Pivot Point S2 | 176.52 |
| Daily Pivot Point S3 | 174.95 |
| Daily Pivot Point R1 | 181.54 |
| Daily Pivot Point R2 | 183.10 |
| Daily Pivot Point R3 | 184.83 |
[/s2If]
Download Nehcap EAWe have two EAs that are operational on our LIVE accounts.
- EA-FIX: Check out the details here. Download EA-FIX . EA-FIX is a non-grid HFT scalper.
- EA-GROWTH: High quality low dd EA using trend grids. Download EA_GROWTHJoin Our Telegram Group
")


