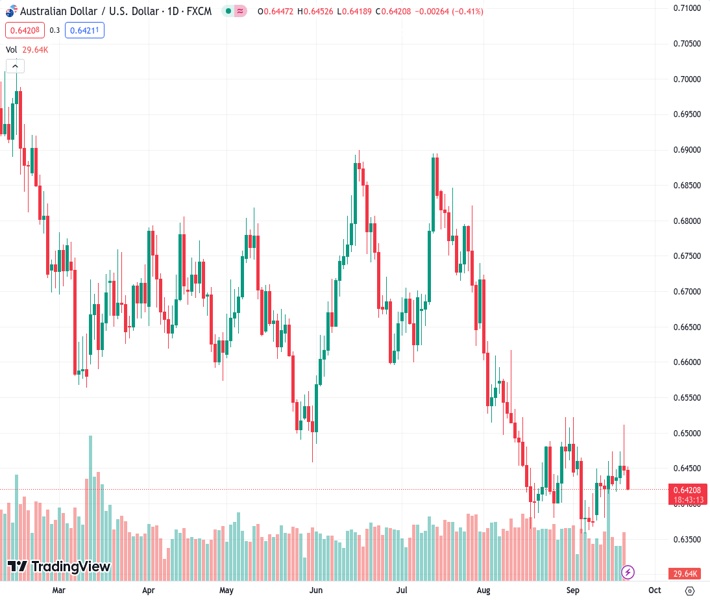
The AUDUSD pair, trading at a level of 0.64211, is moving away from its highest point in three weeks, as it faces increased pressure from continued buying of the USD.
…
This is a premium post.
[s2If !current_user_can(access_s2member_level4)]Please register for FREE REGISTER to read full post below containing analysis. In case of any error or you think you are not able to read the full post below, please email us at support#nehcap.com [lwa][/s2If] [s2If current_user_can(access_s2member_level1)]
- AUD/USD retreats further from a three-week high and is pressured by sustained USD buying.
The pair currently trades last at 0.64211.
The previous day high was 0.6511 while the previous day low was 0.644. The daily 38.2% Fib levels comes at 0.6467, expected to provide resistance. Similarly, the daily 61.8% fib level is at 0.6484, expected to provide resistance.
The AUD/USD pair extends the previous day’s sharp retracement slide from levels just above the 0.6500 psychological mark, or a nearly three-week high, and continues losing ground through the Asian session on Thursday. The downward trajectory drags spot prices to the lower end of the weekly range, around the 0.6420-0.6415 region, and is sponsored by sustained US Dollar (USD) buying.
In fact, the USD Index (DXY), which tracks the Greenback against a basket of currencies, climbs closer to a six-month peak touched last week and remains well supported by the Federal Reserve’s (Fed) hawkish outlook. As was widely anticipated, the US central bank decided to leave interest rates unchanged at the end of a two-day monetary policy meeting on Wednesday. The Fed, however, left the door open for one more 25 bps lift-off in 2023 and maintained its forecast for rates to peak at 5.5% to 5.75% by the end of this year. Moreover, policymakers now see the benchmark rate at 5.1% next year, suggesting just two rate cuts in 2024 as compared to four rate cuts projected previously.
This reaffirms a higher-for-longer narrative pushes the yield on the rate-sensitive two-year US government bond to a 17-year high. Furthermore, the benchmark 10-year yield has climbed to its highest since late 2007, which, along with a softer risk tone, is seen underpinning the safe-haven buck and exerting additional pressure on the risk-sensitive Australian Dollar (AUD). Apart from this, China’s conservative approach to introducing more stimulus measures and speculations that the Reserve Bank of Australia (RBA) might have ended its rate-hiking cycle contribute to the offered tone surrounding the AUD/USD pair. This, in turn, suggests that the path of least resistance for spot prices is to the downside.
Even from a technical perspective, the formation of a bearish flag pattern on short-term charts validates the negative outlook for the AUD/USD pair. That said, it will be prudent to wait for a sustained break below the 0.6400 mark before positioning for any further depreciating move. Market participants now look to the US economic docket – featuring the usual Initial Weekly Jobless Claims, Philly Fed Manufacturing Index and Existing Home Sales data. This, along with the US bond yields and the broader risk sentiment, might influence the USD price dynamics and produce short-term trading opportunities around the AUD/USD pair ahead of Friday’s release of flash PMI prints.
Technical Levels: Supports and Resistances
AUDUSD currently trading at 0.6421 at the time of writing. Pair opened at 0.6448 and is trading with a change of -0.42 % .
| Overview | Overview.1 | |
|---|---|---|
| 0 | Today last price | 0.6421 |
| 1 | Today Daily Change | -0.0027 |
| 2 | Today Daily Change % | -0.4200 |
| 3 | Today daily open | 0.6448 |
The pair remains strongly bearish on the daily time frame. It trades below the 20 SMA @ 0.643, 50 SMA 0.6541, 100 SMA @ 0.6611 and 200 SMA @ 0.6699.
| Trends | Trends.1 | |
|---|---|---|
| 0 | Daily SMA20 | 0.6430 |
| 1 | Daily SMA50 | 0.6541 |
| 2 | Daily SMA100 | 0.6611 |
| 3 | Daily SMA200 | 0.6699 |
The previous day high was 0.6511 while the previous day low was 0.644. The daily 38.2% Fib levels comes at 0.6467, expected to provide resistance. Similarly, the daily 61.8% fib level is at 0.6484, expected to provide resistance.
Note the levels of interest below:
- Pivot support is noted at 0.6421, 0.6395, 0.635
- Pivot resistance is noted at 0.6493, 0.6538, 0.6564
| Levels | Levels.1 |
|---|---|
| Previous Daily High | 0.6511 |
| Previous Daily Low | 0.6440 |
| Previous Weekly High | 0.6474 |
| Previous Weekly Low | 0.6378 |
| Previous Monthly High | 0.6724 |
| Previous Monthly Low | 0.6364 |
| Daily Fibonacci 38.2% | 0.6467 |
| Daily Fibonacci 61.8% | 0.6484 |
| Daily Pivot Point S1 | 0.6421 |
| Daily Pivot Point S2 | 0.6395 |
| Daily Pivot Point S3 | 0.6350 |
| Daily Pivot Point R1 | 0.6493 |
| Daily Pivot Point R2 | 0.6538 |
| Daily Pivot Point R3 | 0.6564 |
[/s2If]
Download Nehcap EAWe have two EAs that are operational on our LIVE accounts.
- EA-FIX: Check out the details here. Download EA-FIX . EA-FIX is a non-grid HFT scalper.
- EA-GROWTH: High quality low dd EA using trend grids. Download EA_GROWTHJoin Our Telegram Group


