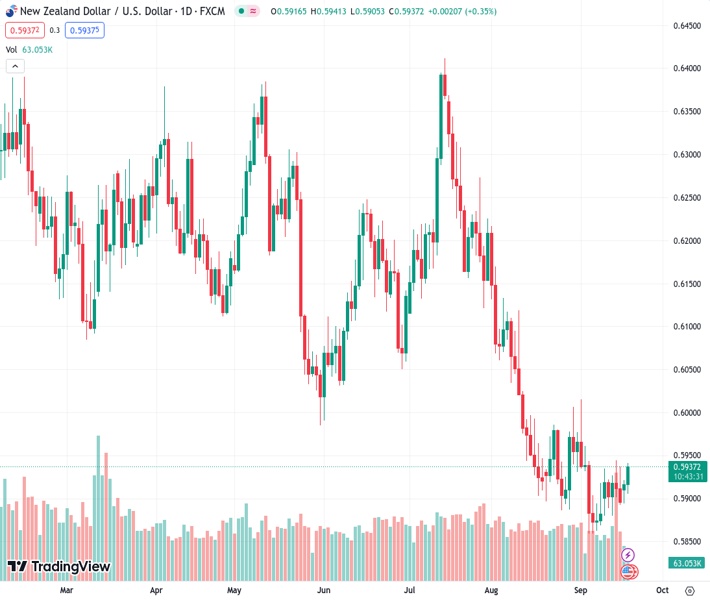
Investors are anticipating the interest rate policy of the Federal Reserve, causing the NZDUSD to trade within a limited range at a price of 0.59360.
…
This is a premium post.
[s2If !current_user_can(access_s2member_level4)]Please register for FREE REGISTER to read full post below containing analysis. In case of any error or you think you are not able to read the full post below, please email us at support#nehcap.com [lwa][/s2If] [s2If current_user_can(access_s2member_level1)]
- NZD/USD trades in a narrow range as investors await the Fed’s interest rate policy.
The pair currently trades last at 0.59360.
The previous day high was 0.5922 while the previous day low was 0.5894. The daily 38.2% Fib levels comes at 0.5911, expected to provide support. Similarly, the daily 61.8% fib level is at 0.5905, expected to provide support.
The NZD/USD pair has oscillated in a narrow range of 0.5900-0.5940 for the past four trading sessions. The Kiwi asset struggles to find as investors await the interest rate decision by the Federal Reserve (Fed), which will be announced on Wednesday.
The US Dollar Index (DXY) faces barricades in extending recovery further as the Fed is expected to deliver a neutral interest rate policy. The US economy is resilient due to easing inflationary pressures and stable labor growth, which would allow Fed policymakers to keep interest rates unchanged at 5.25-5.50%.
Meanwhile, the New Zealand Dollar will dance to the tune of the People’s Bank of China (PBoC) monetary policy, which is also scheduled for Wednesday. The PBoC is expected to continue to favor an expansionary policy framework to diminish deflation risks. Being a proxy for China’s economic recovery, an expansionary policy would support the New Zealand Dollar.
NZD/USD trades in an Ascending Triangle chart pattern on a two-hour scale, which indicates a squeeze in volatility. The upside of the aforementioned chart pattern is restricted near the horizontal resistance plotted from September 6 high at 0.5942 while the upward-sloping trendline is placed from September 7 low at 0.5847.
The 50-period Exponential Moving Average (EMA) at 0.5914 is extremely close to the asset, portraying a sideways trend.
Meanwhile, the Relative Strength Index (RSI) (14) attempts to shift into the bullish range of 60.0080.00. If the RSI (14) manages to do so, a bullish momentum will get triggered.
Going forward, a decisive break above September 14 high at 0.5945 would expose the asset to August 23 high around 0.5980, followed by August 8 low around 0.6035.
On the contrary, a breakdown below September 13 low at 0.5980 would drag the major toward September 7 low at 0.5847. A slippage below the latter would expose the asset to the round-level support at 0.5800.
Technical Levels: Supports and Resistances
NZDUSD currently trading at 0.5937 at the time of writing. Pair opened at 0.5918 and is trading with a change of 0.32 % .
| Overview | Overview.1 | |
|---|---|---|
| 0 | Today last price | 0.5937 |
| 1 | Today Daily Change | 0.0019 |
| 2 | Today Daily Change % | 0.3200 |
| 3 | Today daily open | 0.5918 |
The pair is trading above its 20 Daily moving average @ 0.5921, below its 50 Daily moving average @ 0.6048 , below its 100 Daily moving average @ 0.6109 and below its 200 Daily moving average @ 0.6197
| Trends | Trends.1 | |
|---|---|---|
| 0 | Daily SMA20 | 0.5921 |
| 1 | Daily SMA50 | 0.6048 |
| 2 | Daily SMA100 | 0.6109 |
| 3 | Daily SMA200 | 0.6197 |
The previous day high was 0.5922 while the previous day low was 0.5894. The daily 38.2% Fib levels comes at 0.5911, expected to provide support. Similarly, the daily 61.8% fib level is at 0.5905, expected to provide support.
Note the levels of interest below:
- Pivot support is noted at 0.59, 0.5883, 0.5872
- Pivot resistance is noted at 0.5928, 0.5939, 0.5956
| Levels | Levels.1 |
|---|---|
| Previous Daily High | 0.5922 |
| Previous Daily Low | 0.5894 |
| Previous Weekly High | 0.5945 |
| Previous Weekly Low | 0.5880 |
| Previous Monthly High | 0.6219 |
| Previous Monthly Low | 0.5885 |
| Daily Fibonacci 38.2% | 0.5911 |
| Daily Fibonacci 61.8% | 0.5905 |
| Daily Pivot Point S1 | 0.5900 |
| Daily Pivot Point S2 | 0.5883 |
| Daily Pivot Point S3 | 0.5872 |
| Daily Pivot Point R1 | 0.5928 |
| Daily Pivot Point R2 | 0.5939 |
| Daily Pivot Point R3 | 0.5956 |
[/s2If]
Download Nehcap EAWe have two EAs that are operational on our LIVE accounts.
- EA-FIX: Check out the details here. Download EA-FIX . EA-FIX is a non-grid HFT scalper.
- EA-GROWTH: High quality low dd EA using trend grids. Download EA_GROWTHJoin Our Telegram Group


