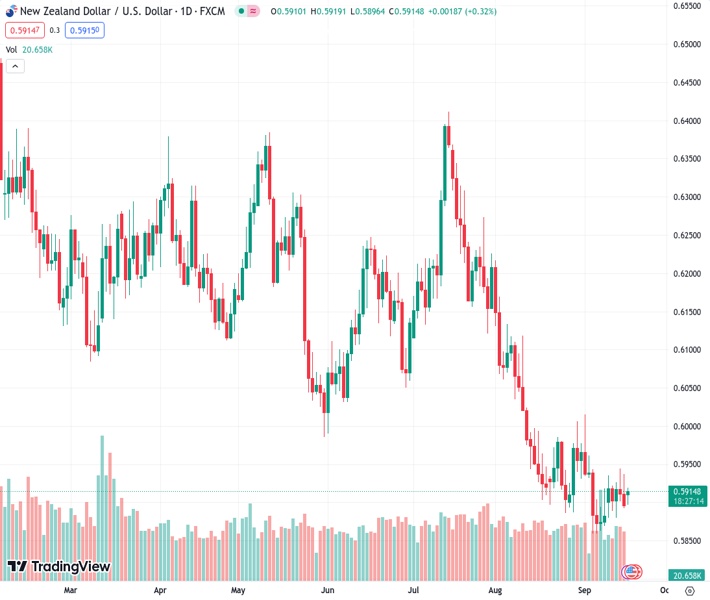
Despite the New Zealand’s weak economic figures, the NZDUSD currency pair has increased in its trading position, reaching a level of 0.59143.
…
This is a premium post.
[s2If !current_user_can(access_s2member_level4)]Please register for FREE REGISTER to read full post below containing analysis. In case of any error or you think you are not able to read the full post below, please email us at support#nehcap.com [lwa][/s2If] [s2If current_user_can(access_s2member_level1)]
- NZD/USD trades higher despite the soft economic data from New Zealand.
The pair currently trades last at 0.59143.
The previous day high was 0.5938 while the previous day low was 0.5892. The daily 38.2% Fib levels comes at 0.591, expected to provide support. Similarly, the daily 61.8% fib level is at 0.592, expected to provide resistance.
NZD/USD starts the week on a positive note, trading higher around 0.5910 during the Asian session on Monday. The pair is experiencing upward support ahead of the interest rate decision by the US Federal Reserve (Fed) scheduled on Wednesday.
However, downbeat economic data from New Zealand could put a ceiling on the potential of the Aussie pair. The Business NZ PSI report printed a reading of 47.1 lower than the previous 47.8 figure, which showed that business conditions in the service sector weakened in August.
Moreover, prior to the release of New Zealand’s official Gross Domestic Product (GDP) data this week, the New Zealand Institute of Economic Research (NZIER) has issued its Consensus Forecasts for the country’s growth and inflation figures.
The consensus Forecasts showed the annual average GDP growth is expected to decelerate to 0.4% from 0.6% previously in the year ending March 2024. Subsequently, there is a projected recovery with GDP growth reaching 1.1 percent in 2025.
Higher interest rates are beginning to curtail demand as the consequences of prior rises in the Reserve Bank’s Official Cash Rate (OCR) are now filtering into the broader economy. Additionally, there is a downside risk stemming from reduced demand for New Zealand exports, primarily attributed to the dimmer growth prospects in China.
US Dollar (USD) has weakened following the release of downbeat consumer sentiment data from the United States (US) on Friday. The preliminary Michigan Consumer Sentiment Index printed a reading of 67.7, down from the previous figure of 69.5 and below the expected reading of 69.1 for September.
US Dollar Index (DXY), which gauges the performance of the Greenback against six other major currencies, concluded its ninth week with a gain of 0.26%. The spot price is trading lower around 105.30 at the time of writing. However, the upbeat US Treasury yields could limit the losses of the Greenback. The yield on US 10-year bond improved to 4.40%
The expectations regarding the Fed’s actions are being reinforced by key economic data from the United States in the past week. The probability of one more interest rate hike by the end of 2023 is bolstered by several positive economic indicators.
The Consumer Price Index (CPI), which measures inflation, exceeded expectations. Additionally, Retail Sales for the same month and Jobless Claims for the second week of September both revealed favorable outcomes for the US economy.
Market participants will closely monitor the Fed’s monetary policy decisions scheduled for Wednesday and will pay close attention to the central bank’s communications for any clues regarding the future direction of interest rates.
Technical Levels: Supports and Resistances
NZDUSD currently trading at 0.5908 at the time of writing. Pair opened at 0.5898 and is trading with a change of 0.17 % .
| Overview | Overview.1 | |
|---|---|---|
| 0 | Today last price | 0.5908 |
| 1 | Today Daily Change | 0.0010 |
| 2 | Today Daily Change % | 0.1700 |
| 3 | Today daily open | 0.5898 |
The pair remains strongly bearish on the daily time frame. It trades below the 20 SMA @ 0.5922, 50 SMA 0.6054, 100 SMA @ 0.6111 and 200 SMA @ 0.6199.
| Trends | Trends.1 | |
|---|---|---|
| 0 | Daily SMA20 | 0.5922 |
| 1 | Daily SMA50 | 0.6054 |
| 2 | Daily SMA100 | 0.6111 |
| 3 | Daily SMA200 | 0.6199 |
The previous day high was 0.5938 while the previous day low was 0.5892. The daily 38.2% Fib levels comes at 0.591, expected to provide support. Similarly, the daily 61.8% fib level is at 0.592, expected to provide resistance.
Note the levels of interest below:
- Pivot support is noted at 0.5881, 0.5863, 0.5835
- Pivot resistance is noted at 0.5927, 0.5955, 0.5973
| Levels | Levels.1 |
|---|---|
| Previous Daily High | 0.5938 |
| Previous Daily Low | 0.5892 |
| Previous Weekly High | 0.5945 |
| Previous Weekly Low | 0.5880 |
| Previous Monthly High | 0.6219 |
| Previous Monthly Low | 0.5885 |
| Daily Fibonacci 38.2% | 0.5910 |
| Daily Fibonacci 61.8% | 0.5920 |
| Daily Pivot Point S1 | 0.5881 |
| Daily Pivot Point S2 | 0.5863 |
| Daily Pivot Point S3 | 0.5835 |
| Daily Pivot Point R1 | 0.5927 |
| Daily Pivot Point R2 | 0.5955 |
| Daily Pivot Point R3 | 0.5973 |
[/s2If]
Download Nehcap EAWe have two EAs that are operational on our LIVE accounts.
- EA-FIX: Check out the details here. Download EA-FIX . EA-FIX is a non-grid HFT scalper.
- EA-GROWTH: High quality low dd EA using trend grids. Download EA_GROWTHJoin Our Telegram Group


