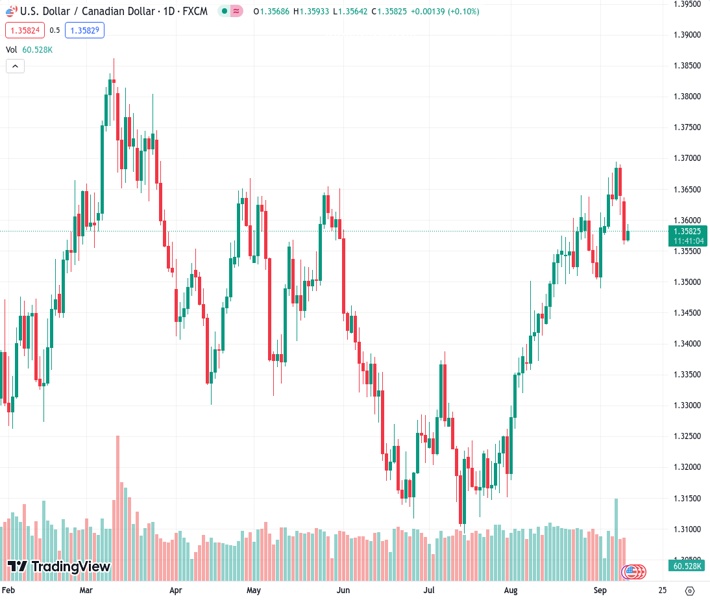
The US dollar to Canadian dollar exchange rate of 1.35816 has rebounded from its previous decline, just before the release of US Headline CPI data.
…
This is a premium post.
[s2If !current_user_can(access_s2member_level4)]Please register for FREE REGISTER to read full post below containing analysis. In case of any error or you think you are not able to read the full post below, please email us at support#nehcap.com [lwa][/s2If] [s2If current_user_can(access_s2member_level1)]
- USD/CAD recovers from the recent losses ahead of US Headline CPI.
The pair currently trades last at 1.35816.
The previous day high was 1.3639 while the previous day low was 1.3561. The daily 38.2% Fib levels comes at 1.3591, expected to provide resistance. Similarly, the daily 61.8% fib level is at 1.3609, expected to provide resistance.
USD/CAD trades higher around 1.3580 during the European session on Tuesday, snapping the two-day losing streak. The pair faced challenges due to the downbeat US Dollar (USD) on Monday. However, the improved US Treasury yields might limit the losses of the buck.
The improved prices of WTI Crude oil are contributing to the support in strengthening the Canadian Dollar (CAD) as Canada is one of the largest suppliers of crude oil to the United States. This scenario is acting as a limiting factor on the potential strength of the USD/CAD pair.
Western Texas Intermediate (WTI), the US crude oil benchmark, trades higher around $87.30 per barrel at the time of writing. This price level is being supported by the prolonged crude output cuts implemented by Saudi Arabia and Russia, propelling WTI prices to their highest levels since November 2022.
Bank of Canada (BoC) Governor Tiff Macklem indicated on Thursday that monetary policy might need to be appropriately restrictive to restore price stability. However, Macklem also expressed concern about the persistence of underlying inflation.
US Dollar Index (DXY), which measures the performance of the US Dollar (USD), trades higher around 104.80. The Greenback is anticipated to remain resilient, supported by the continuous stream of positive economic data from the United States (US).
Investors will closely watch the upcoming release of the Consumer Price Index (CPI) for August from the US, scheduled for Wednesday. This data release could offer additional insights into the US inflation situation.
US CPI is expected to show a 0.5% month-on-month increase, representing an improvement from the previous period’s 0.2% reading. While the Core CPI figure is anticipated to remain consistent at 0.2%.
Investors have been pricing in the odds of a 25 basis point (bps) interest rate hike by the US Federal Reserve (Fed) in November or December meetings. Along with this, the Fed is expected to sustain higher interest rates over a prolonged period. This hawkish tone might lift the US Dollar USD) and limit the downside of the USD/CAD pair.
Technical Levels: Supports and Resistances
USDCAD currently trading at 1.3579 at the time of writing. Pair opened at 1.3572 and is trading with a change of 0.05 % .
| Overview | Overview.1 | |
|---|---|---|
| 0 | Today last price | 1.3579 |
| 1 | Today Daily Change | 0.0007 |
| 2 | Today Daily Change % | 0.0500 |
| 3 | Today daily open | 1.3572 |
The pair remains strongly bullish on the daily timeframe. It trades above its 20 SMA @ 1.3574, 50 SMA 1.3394, 100 SMA @ 1.3406 and 200 SMA @ 1.3467.
| Trends | Trends.1 | |
|---|---|---|
| 0 | Daily SMA20 | 1.3574 |
| 1 | Daily SMA50 | 1.3394 |
| 2 | Daily SMA100 | 1.3406 |
| 3 | Daily SMA200 | 1.3467 |
The previous day high was 1.3639 while the previous day low was 1.3561. The daily 38.2% Fib levels comes at 1.3591, expected to provide resistance. Similarly, the daily 61.8% fib level is at 1.3609, expected to provide resistance.
Note the levels of interest below:
- Pivot support is noted at 1.3542, 1.3513, 1.3465
- Pivot resistance is noted at 1.362, 1.3669, 1.3698
| Levels | Levels.1 |
|---|---|
| Previous Daily High | 1.3639 |
| Previous Daily Low | 1.3561 |
| Previous Weekly High | 1.3694 |
| Previous Weekly Low | 1.3576 |
| Previous Monthly High | 1.3640 |
| Previous Monthly Low | 1.3184 |
| Daily Fibonacci 38.2% | 1.3591 |
| Daily Fibonacci 61.8% | 1.3609 |
| Daily Pivot Point S1 | 1.3542 |
| Daily Pivot Point S2 | 1.3513 |
| Daily Pivot Point S3 | 1.3465 |
| Daily Pivot Point R1 | 1.3620 |
| Daily Pivot Point R2 | 1.3669 |
| Daily Pivot Point R3 | 1.3698 |
[/s2If]
Download Nehcap EAWe have two EAs that are operational on our LIVE accounts.
- EA-FIX: Check out the details here. Download EA-FIX . EA-FIX is a non-grid HFT scalper.
- EA-GROWTH: High quality low dd EA using trend grids. Download EA_GROWTHJoin Our Telegram Group


