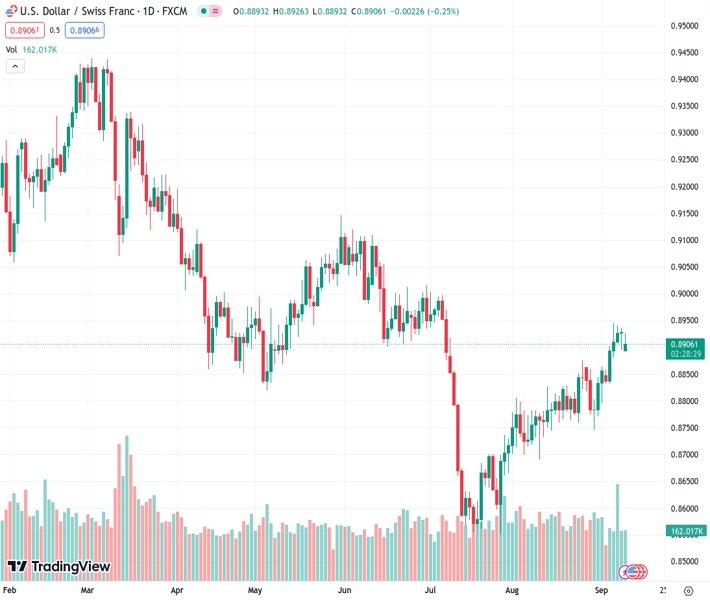
The USD/CHF pair, currently trading at 0.8908, is facing resistance at the 0.9000 level and has been unable to surpass it.
…
This is a premium post.
[s2If !current_user_can(access_s2member_level4)]Please register for FREE REGISTER to read full post below containing analysis. In case of any error or you think you are not able to read the full post below, please email us at support#nehcap.com [lwa][/s2If] [s2If current_user_can(access_s2member_level1)]
- USD/CHF trades at 0.8908, unable to break the 0.9000 level.
The pair currently trades last at 0.89060.
The previous day high was 0.8937 while the previous day low was 0.8895. The daily 38.2% Fib levels comes at 0.8921, expected to provide resistance. Similarly, the daily 61.8% fib level is at 0.8911, expected to provide resistance.
The Greenback (USD) losses ground versus the Swiss Franc (CHF) after developments during the Asian session weakened the former. China’s positive data, mainly inflation back at positive territory, and hawkish words from the Bank of Japan (BoJ) Governor Kazuo Ueda spurred USD weakness. Hence, the USD/CHF is trading at 0.8908 after hitting a daily high of 0.8926.
During the last four trading days, the USD/CHF has remained at around the 0.8900 figure, unable to threaten the 0.9000 figure, as volatility keeps the pair consolidating at around a 40 pip range. It should be said the 50 and 200-day Moving Averages (DMAs) turned flat, with the former below price action at 0.8774, while the latter stays at a bearish position at 0.9048, indicating the lack of a trend. However, price action shows a higher series of peaks and throughs but at the expense of an increase in volatility that could break the trading range.
The USD/CHF one-hour chart portrays the pair as neutral to bearish biased, as price action sits below the 50-hour Simple Moving Average (SMA) at 0.8916. However, to reinforce the bias, sellers must crack the September 8 daily low of 0.8895 to challenge the next support area, seen at the September 6 daily low of 0.8881. Once cleared, the next stop would be the 200-hour SMA at 0.8871, followed by the September 5 low of 0.8819. Contrarily, the first resistance is seen at the 50-hour SMA at 0.8916, followed by the September 8 daily high of 0.8936.
Technical Levels: Supports and Resistances
USDCHF currently trading at 0.8907 at the time of writing. Pair opened at 0.893 and is trading with a change of -0.26 % .
| Overview | Overview.1 | |
|---|---|---|
| 0 | Today last price | 0.8907 |
| 1 | Today Daily Change | -0.0023 |
| 2 | Today Daily Change % | -0.2600 |
| 3 | Today daily open | 0.8930 |
The pair is trading above its 20 Daily moving average @ 0.8832, above its 50 Daily moving average @ 0.8777 , above its 100 Daily moving average @ 0.8879 and below its 200 Daily moving average @ 0.9053
| Trends | Trends.1 | |
|---|---|---|
| 0 | Daily SMA20 | 0.8832 |
| 1 | Daily SMA50 | 0.8777 |
| 2 | Daily SMA100 | 0.8879 |
| 3 | Daily SMA200 | 0.9053 |
The previous day high was 0.8937 while the previous day low was 0.8895. The daily 38.2% Fib levels comes at 0.8921, expected to provide resistance. Similarly, the daily 61.8% fib level is at 0.8911, expected to provide resistance.
Note the levels of interest below:
- Pivot support is noted at 0.8904, 0.8879, 0.8862
- Pivot resistance is noted at 0.8946, 0.8962, 0.8988
| Levels | Levels.1 |
|---|---|
| Previous Daily High | 0.8937 |
| Previous Daily Low | 0.8895 |
| Previous Weekly High | 0.8945 |
| Previous Weekly Low | 0.8833 |
| Previous Monthly High | 0.8876 |
| Previous Monthly Low | 0.8690 |
| Daily Fibonacci 38.2% | 0.8921 |
| Daily Fibonacci 61.8% | 0.8911 |
| Daily Pivot Point S1 | 0.8904 |
| Daily Pivot Point S2 | 0.8879 |
| Daily Pivot Point S3 | 0.8862 |
| Daily Pivot Point R1 | 0.8946 |
| Daily Pivot Point R2 | 0.8962 |
| Daily Pivot Point R3 | 0.8988 |
[/s2If]
Download Nehcap EAWe have two EAs that are operational on our LIVE accounts.
- EA-FIX: Check out the details here. Download EA-FIX . EA-FIX is a non-grid HFT scalper.
- EA-GROWTH: High quality low dd EA using trend grids. Download EA_GROWTHJoin Our Telegram Group


