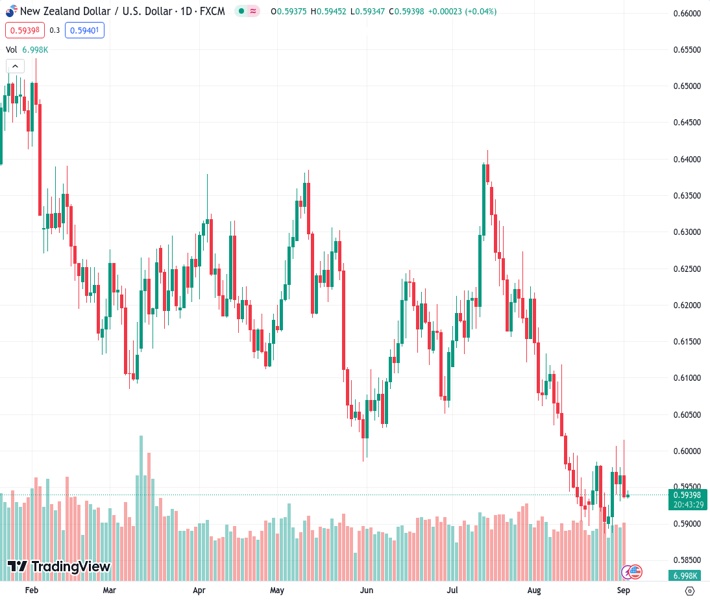
The NZDUSD pair is currently trading around 0.5956, lower from its previous level of 0.6015.
…
This is a premium post.
[s2If !current_user_can(access_s2member_level4)]Please register for FREE REGISTER to read full post below containing analysis. In case of any error or you think you are not able to read the full post below, please email us at support#nehcap.com [lwa][/s2If] [s2If current_user_can(access_s2member_level1)]
- NZD/USD remains on the defensive around 0.5956 after retracing from 0.6015.
The pair currently trades last at 0.59397.
The previous day high was 0.6015 while the previous day low was 0.5934. The daily 38.2% Fib levels comes at 0.5965, expected to provide resistance. Similarly, the daily 61.8% fib level is at 0.5984, expected to provide resistance.
The NZD/USD pair consolidates its recent losses below the 0.6000 barrier during the early Asian session on Monday. The pair currently trades near 0.5956, gaining 0.17% on the day. The Kiwi (NZD) is weakened against the US Dollar (USD) following Friday’s upbeat US economic data and the headlines surrounding the US-China trade war tension.
The US Bureau of Labor Statistics reported on Friday that Nonfarm Payrolls (NFP) for August came in at 187,000, better than the estimation of 170,000 and July’s reading of 157,000. The Unemployment Rate fell significantly to 3.8%, compared to the market estimate of 3.5% and the prior data of 3.5%. The monthly Average Hourly Earnings rose by 0.2%, against the expectation of 0.3%. Meanwhile, the US Manufacturing PMI came in at 47.6 versus 46.4 prior and better than the market consensus of 47.0.
Following the economic data, markets believe that the Federal Reserve (Fed) is likely to end the tightening cycle. According to the CME FedWatch tool, markets have priced in that the Fed will not hike rates in its September meeting and the odds of raising rates in November and December decreased to almost 35%.
On the Kiwi front, the New Zealand Terms of Trade Index for the second quarter improved to 0.4% versus a 1.5% drop in the previous reading and better than the expectation of a 1.3% drop. The upbeat data failed to impress the NZD/USD bulls amid the US holiday on Monday. Last week, the ANZ – Roy Morgan Consumer Confidence for August showed that consumer confidence in New Zealand improved marginally to 85 in August from 83.7 but remained at subdued levels.
Apart from this, US Commerce Secretary Raimondo stated that China is making the situation more difficult. He added that a lack of a predictable environment and a fair playing field are the primary drivers affecting US business in China. The renewed tension between the US and China might exert some selling pressure on the China-proxy Kiwi and act as a headwind for the NZD/USD pair.
The US market is closed for the Labor Day holiday. Market participants will digest the US economic data on Friday ahead of the Chinese Caixin Services PMI for August due on Tuesday. Also, the US ISM Services PMI will be released on Wednesday. Traders will take cues from the data and find trading opportunities around the NZD/USD pair.
Technical Levels: Supports and Resistances
NZDUSD currently trading at 0.5956 at the time of writing. Pair opened at 0.5946 and is trading with a change of 0.17 % .
| Overview | Overview.1 | |
|---|---|---|
| 0 | Today last price | 0.5956 |
| 1 | Today Daily Change | 0.0010 |
| 2 | Today Daily Change % | 0.1700 |
| 3 | Today daily open | 0.5946 |
The pair remains strongly bearish on the daily time frame. It trades below the 20 SMA @ 0.5969, 50 SMA 0.6103, 100 SMA @ 0.6138 and 200 SMA @ 0.6221.
| Trends | Trends.1 | |
|---|---|---|
| 0 | Daily SMA20 | 0.5969 |
| 1 | Daily SMA50 | 0.6103 |
| 2 | Daily SMA100 | 0.6138 |
| 3 | Daily SMA200 | 0.6221 |
The previous day high was 0.6015 while the previous day low was 0.5934. The daily 38.2% Fib levels comes at 0.5965, expected to provide resistance. Similarly, the daily 61.8% fib level is at 0.5984, expected to provide resistance.
Note the levels of interest below:
- Pivot support is noted at 0.5915, 0.5884, 0.5834
- Pivot resistance is noted at 0.5996, 0.6046, 0.6077
| Levels | Levels.1 |
|---|---|
| Previous Daily High | 0.6015 |
| Previous Daily Low | 0.5934 |
| Previous Weekly High | 0.6015 |
| Previous Weekly Low | 0.5887 |
| Previous Monthly High | 0.6219 |
| Previous Monthly Low | 0.5885 |
| Daily Fibonacci 38.2% | 0.5965 |
| Daily Fibonacci 61.8% | 0.5984 |
| Daily Pivot Point S1 | 0.5915 |
| Daily Pivot Point S2 | 0.5884 |
| Daily Pivot Point S3 | 0.5834 |
| Daily Pivot Point R1 | 0.5996 |
| Daily Pivot Point R2 | 0.6046 |
| Daily Pivot Point R3 | 0.6077 |
[/s2If]
Download Nehcap EAWe have two EAs that are operational on our LIVE accounts.
- EA-FIX: Check out the details here. Download EA-FIX . EA-FIX is a non-grid HFT scalper.
- EA-GROWTH: High quality low dd EA using trend grids. Download EA_GROWTHJoin Our Telegram Group


