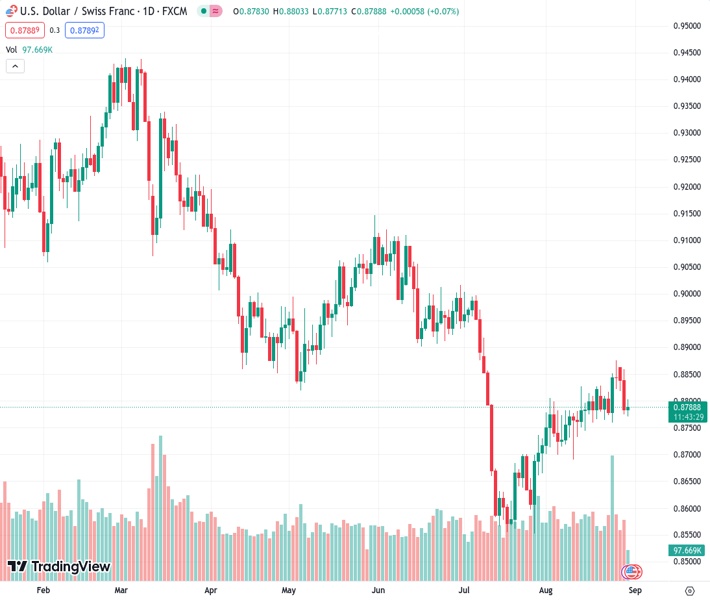
The USDCHF pair rises to 0.87930 as a result of negative Swiss economic data.
…
This is a premium post.
[s2If !current_user_can(access_s2member_level4)]Please register for FREE REGISTER to read full post below containing analysis. In case of any error or you think you are not able to read the full post below, please email us at support#nehcap.com [lwa][/s2If] [s2If current_user_can(access_s2member_level1)]
- USD/CHF rebounds due to downbeat Swiss economic data.
The pair currently trades last at 0.87930.
The previous day high was 0.8859 while the previous day low was 0.8775. The daily 38.2% Fib levels comes at 0.8807, expected to provide resistance. Similarly, the daily 61.8% fib level is at 0.8827, expected to provide resistance.
USD/CHF rebounds from losses registered in the previous two days, trading around 0.8800 psychological level at the time of writing during the European session on Wednesday. The pair is experiencing upward pressure due to Switzerland’s downbeat ZEW Survey – Expectations (Aug) released on Wednesday. The report showed a reading of -38.6 against the market consensus of -31.3 and from the previous -32.6 figure.
As per Credit Suisse, the majority of analysts anticipate that the Swiss National Bank (SNB) will execute another increase in its key interest rates during the third quarter (Q3), given the expected upsurge in inflation projected for the upcoming autumn season. Moreover, the Swiss Consumer Price Index (CPI) will be released on Friday, which is expected to slow down in August. Market participants will observe the inflation figure to better understand the further monetary policy decision by SNB.
The US Dollar Index (DXY) treads waters around 103.70, recovering from the recent losses. This turnaround can be attributed to the rebound in US Treasury yields, which is offering support to the US Dollar. It’s worth noting that the prevailing dovish sentiment surrounding the policy stance of the US Federal Reserve (Fed) is contributing to a weakening of the Greenback.
During the Jackson Hole Symposium, Fed Chairman Jerome Powell emphasized that any future decisions regarding interest rates will be guided by data-driven analysis. As a result, investors are set to closely monitor the upcoming US economic data, aiming to attain a more comprehensive understanding of the economic path of the United States (US).
Wednesday’s macroeconomic schedule highlights important events, notably the unveiling of US ADP Employment Change statistics for August and the preliminary Gross Domestic Product Annualized data for the second quarter (Q2). These datasets are expected to have a substantial influence on shaping strategies before engaging in fresh trading positions on the USD/CHF pair.
Technical Levels: Supports and Resistances
USDCHF currently trading at 0.8795 at the time of writing. Pair opened at 0.8784 and is trading with a change of 0.13 % .
| Overview | Overview.1 | |
|---|---|---|
| 0 | Today last price | 0.8795 |
| 1 | Today Daily Change | 0.0011 |
| 2 | Today Daily Change % | 0.1300 |
| 3 | Today daily open | 0.8784 |
The pair is trading above its 20 Daily moving average @ 0.8785, above its 50 Daily moving average @ 0.8791 , below its 100 Daily moving average @ 0.8885 and below its 200 Daily moving average @ 0.9076
| Trends | Trends.1 | |
|---|---|---|
| 0 | Daily SMA20 | 0.8785 |
| 1 | Daily SMA50 | 0.8791 |
| 2 | Daily SMA100 | 0.8885 |
| 3 | Daily SMA200 | 0.9076 |
The previous day high was 0.8859 while the previous day low was 0.8775. The daily 38.2% Fib levels comes at 0.8807, expected to provide resistance. Similarly, the daily 61.8% fib level is at 0.8827, expected to provide resistance.
Note the levels of interest below:
- Pivot support is noted at 0.8753, 0.8722, 0.8669
- Pivot resistance is noted at 0.8837, 0.889, 0.8921
| Levels | Levels.1 |
|---|---|
| Previous Daily High | 0.8859 |
| Previous Daily Low | 0.8775 |
| Previous Weekly High | 0.8876 |
| Previous Weekly Low | 0.8760 |
| Previous Monthly High | 0.9005 |
| Previous Monthly Low | 0.8552 |
| Daily Fibonacci 38.2% | 0.8807 |
| Daily Fibonacci 61.8% | 0.8827 |
| Daily Pivot Point S1 | 0.8753 |
| Daily Pivot Point S2 | 0.8722 |
| Daily Pivot Point S3 | 0.8669 |
| Daily Pivot Point R1 | 0.8837 |
| Daily Pivot Point R2 | 0.8890 |
| Daily Pivot Point R3 | 0.8921 |
[/s2If]
Download Nehcap EAWe have two EAs that are operational on our LIVE accounts.
- EA-FIX: Check out the details here. Download EA-FIX . EA-FIX is a non-grid HFT scalper.
- EA-GROWTH: High quality low dd EA using trend grids. Download EA_GROWTHJoin Our Telegram Group
")


