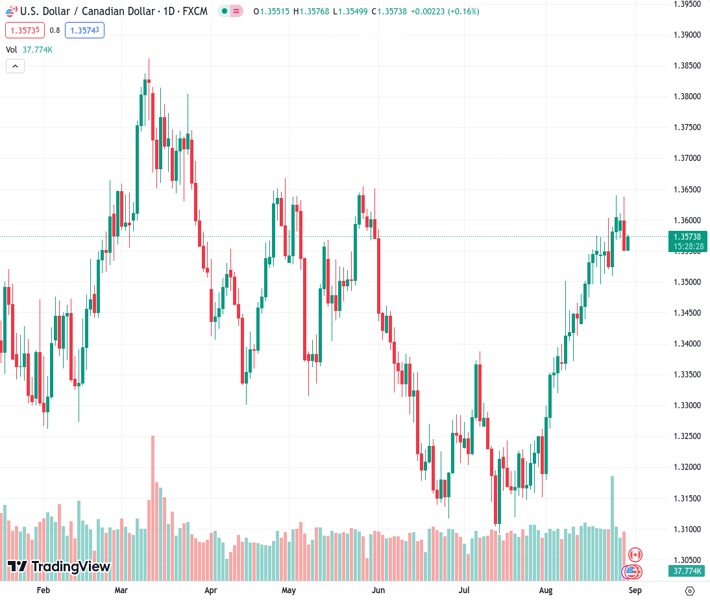
The USDCAD pair, trading at 1.35739, is gaining buying interest to reduce its largest daily decline in a month.
…
This is a premium post.
[s2If !current_user_can(access_s2member_level4)]Please register for FREE REGISTER to read full post below containing analysis. In case of any error or you think you are not able to read the full post below, please email us at support#nehcap.com [lwa][/s2If] [s2If current_user_can(access_s2member_level1)]
- USD/CAD picks up bids to pare the biggest daily loss in a month.
The pair currently trades last at 1.35739.
The previous day high was 1.3637 while the previous day low was 1.355. The daily 38.2% Fib levels comes at 1.3583, expected to provide resistance. Similarly, the daily 61.8% fib level is at 1.3604, expected to provide resistance.
USD/CAD consolidates the biggest daily loss in a month while posting mild gains around 1.3575 ahead of Wednesday’s European session. In doing so, the Loonie pair prints the first daily run-up, so far, despite upbeat prices of Canada’s main export item, namely the WTI crude oil. The reason could be linked to the US Dollar’s recovery ahead of the top-tier US data.
That said, the WTI crude oil renews weekly top around $81.40 amid expectations of witnessing mores stimulus from China, as well as higher demand due to the adverse weather conditions in the West. Additionally, a heavy draw of the US inventories, per the American Petroleum Institute’s (API) weekly Crude Oil Stocks Change data, also underpin the black gold’s run-up.
Elsewhere, the US Dollar Index (DXY) rises 0.20% to around 103.65 by the press time, reversing the previous day’s losses, the biggest in six weeks, amid market’s preparations for the key data/events. Also likely to have triggered the DXY rebound are the sluggish Treasury bond yields and doubts about the US-China ties.
It’s worth noting that the previous day’s US consumer confidence, employment and housing data flagged fears of the Fed’s policy pivot, especially after Fed Chair Jerome Powell highlighted the data-dependency for future moves to defend the hawkish bias. The same drowned the Greenback and the US Treasury bond yields.
However, the cautious mood ahead of today’s US ADP Employment Change, the final readings of the US second quarter (Q2) Gross Domestic Product (GDP) and the Personal Consumption Expenditure (PCE) data trigger the US Dollar’s corrective bounce. Furthermore, the US Treasury bond yields remain sidelined at a two-week low after reversing from the multi-year high in the last few days.
Additionally helping the USD/CAD buyers are the mixed concerns about the US-China ties. China recently conveyed its dislike for the US Commerce Secretary Gina Raimondo’s complaints about the hardships for the US firms in China. Previously, chatters about the early rate cuts from the People’s Bank of China (PBoC) and a cut into the mortgage rates, as well as likely improvement in the US-China ties, favored the market’s optimism. It should be noted that the International Monetary Fund’s (IMF) readiness to be more cautious while allocating the Special Drawing Rights (SDRs) in the future, due to the current environment of higher interest rates and inflation, also seems to renew the US Dollar’s demand.
Amid these plays, the US stock futures print mild gains and prod the riskier assets, which in turn propel the USD/CAD prices.
USD/CAD recovery remains elusive unless providing a daily closing beyond a four-month-old resistance line, around 1.3605 by the press time.
Technical Levels: Supports and Resistances
USDCAD currently trading at 1.3574 at the time of writing. Pair opened at 1.3552 and is trading with a change of 0.16% % .
| Overview | Overview.1 | |
|---|---|---|
| 0 | Today last price | 1.3574 |
| 1 | Today Daily Change | 0.0022 |
| 2 | Today Daily Change % | 0.16% |
| 3 | Today daily open | 1.3552 |
The pair remains strongly bullish on the daily timeframe. It trades above its 20 SMA @ 1.3486, 50 SMA 1.3323, 100 SMA @ 1.3391 and 200 SMA @ 1.3461.
| Trends | Trends.1 | |
|---|---|---|
| 0 | Daily SMA20 | 1.3486 |
| 1 | Daily SMA50 | 1.3323 |
| 2 | Daily SMA100 | 1.3391 |
| 3 | Daily SMA200 | 1.3461 |
The previous day high was 1.3637 while the previous day low was 1.355. The daily 38.2% Fib levels comes at 1.3583, expected to provide resistance. Similarly, the daily 61.8% fib level is at 1.3604, expected to provide resistance.
Note the levels of interest below:
- Pivot support is noted at 1.3522, 1.3493, 1.3435
- Pivot resistance is noted at 1.361, 1.3667, 1.3697
| Levels | Levels.1 |
|---|---|
| Previous Daily High | 1.3637 |
| Previous Daily Low | 1.3550 |
| Previous Weekly High | 1.3640 |
| Previous Weekly Low | 1.3496 |
| Previous Monthly High | 1.3387 |
| Previous Monthly Low | 1.3093 |
| Daily Fibonacci 38.2% | 1.3583 |
| Daily Fibonacci 61.8% | 1.3604 |
| Daily Pivot Point S1 | 1.3522 |
| Daily Pivot Point S2 | 1.3493 |
| Daily Pivot Point S3 | 1.3435 |
| Daily Pivot Point R1 | 1.3610 |
| Daily Pivot Point R2 | 1.3667 |
| Daily Pivot Point R3 | 1.3697 |
[/s2If]
Download Nehcap EAWe have two EAs that are operational on our LIVE accounts.
- EA-FIX: Check out the details here. Download EA-FIX . EA-FIX is a non-grid HFT scalper.
- EA-GROWTH: High quality low dd EA using trend grids. Download EA_GROWTHJoin Our Telegram Group
")


