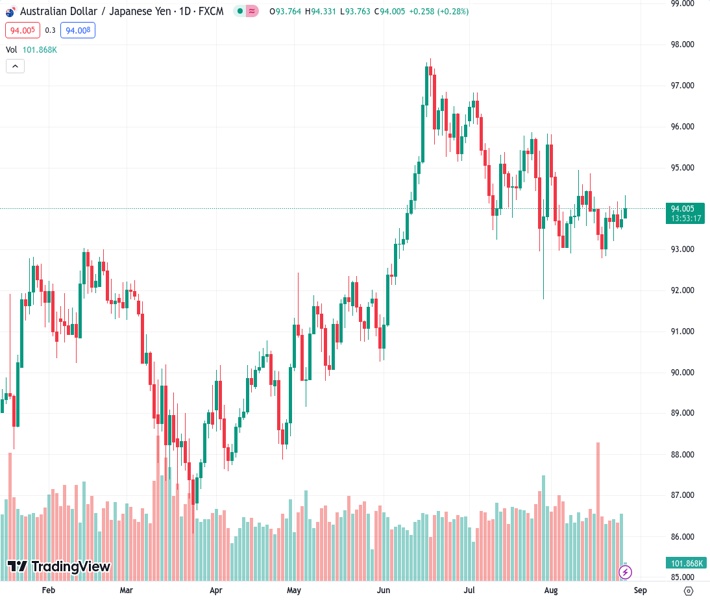
The currency pair AUDJPY is currently trading at 93.9640 and is staying within a trend channel that is sloping downwards on the four-hour chart.
…
This is a premium post.
[s2If !current_user_can(access_s2member_level4)]Please register for FREE REGISTER to read full post below containing analysis. In case of any error or you think you are not able to read the full post below, please email us at support#nehcap.com [lwa][/s2If] [s2If current_user_can(access_s2member_level1)]
- AUD/JPY trades within a descending trend channel on the four-hour chart.
The pair currently trades last at 93.9640.
The previous day high was 93.98 while the previous day low was 93.5. The daily 38.2% Fib levels comes at 93.79, expected to provide support. Similarly, the daily 61.8% fib level is at 93.68, expected to provide support.
The AUD/JPY cross edges higher above the 94.00 mark during the early European session on Monday. The Chinese finance ministry said on Sunday that the authorities would reduce the 0.1% duty on stock trading to stimulate the capital market and strengthen investor confidence. This development triggers a risk-on mood and boosts the China-proxy Australian Dollar against the Japanese Yen.
Technically, AUD/JPY trades within a descending trend channel since the middle of June on the four-hour chart. That said, the path of least resistance for the AUD/JPY is to the upside as the cross just holds above the 50- and 100-hour Exponential Moving Averages (EMAs).
The immediate resistance level for AUD/JPY emerges at 94.40, highlighting the upper boundary of a descending trend channel. Any follow-through buying above the latter will see a rally to 94.90 (a high of August 15). The next upside stop to watch is 95.40 (high of July 14) en route to 95.85 (high of July 31).
Looking at the downside, the cross will meet the initial support level at 93.85 (the 50-hour EMA), followed by 93.75 (the 100-hour EMA). The next downside filter appears at 93.50 (low of August 22). The key contention level is seen near a psychological figure at 93.00. A break below the latter will see a drop to 92.60 (the midline of the descending trend channel) en route to 91.80 (the high of May 8) and finally at 91.35 (the lower limit of the descending trend channel).
It’s worth noting that the Relative Strength Index (RSI) holds above 50 and the Moving Average Convergence/Divergence (MACD) stands in the bullish territory. Both momentum indicators support the buyers for now.
Technical Levels: Supports and Resistances
AUDJPY currently trading at 94.09 at the time of writing. Pair opened at 93.78 and is trading with a change of 0.33 % .
| Overview | Overview.1 | |
|---|---|---|
| 0 | Today last price | 94.09 |
| 1 | Today Daily Change | 0.31 |
| 2 | Today Daily Change % | 0.33 |
| 3 | Today daily open | 93.78 |
The pair is trading above its 20 Daily moving average @ 93.91, below its 50 Daily moving average @ 94.79 , above its 100 Daily moving average @ 93.07 and above its 200 Daily moving average @ 91.9
| Trends | Trends.1 | |
|---|---|---|
| 0 | Daily SMA20 | 93.91 |
| 1 | Daily SMA50 | 94.79 |
| 2 | Daily SMA100 | 93.07 |
| 3 | Daily SMA200 | 91.90 |
The previous day high was 93.98 while the previous day low was 93.5. The daily 38.2% Fib levels comes at 93.79, expected to provide support. Similarly, the daily 61.8% fib level is at 93.68, expected to provide support.
Note the levels of interest below:
- Pivot support is noted at 93.53, 93.27, 93.05
- Pivot resistance is noted at 94.01, 94.24, 94.49
| Levels | Levels.1 |
|---|---|
| Previous Daily High | 93.98 |
| Previous Daily Low | 93.50 |
| Previous Weekly High | 94.18 |
| Previous Weekly Low | 92.83 |
| Previous Monthly High | 96.84 |
| Previous Monthly Low | 91.79 |
| Daily Fibonacci 38.2% | 93.79 |
| Daily Fibonacci 61.8% | 93.68 |
| Daily Pivot Point S1 | 93.53 |
| Daily Pivot Point S2 | 93.27 |
| Daily Pivot Point S3 | 93.05 |
| Daily Pivot Point R1 | 94.01 |
| Daily Pivot Point R2 | 94.24 |
| Daily Pivot Point R3 | 94.49 |
[/s2If]
Download Nehcap EAWe have two EAs that are operational on our LIVE accounts.
- EA-FIX: Check out the details here. Download EA-FIX . EA-FIX is a non-grid HFT scalper.
- EA-GROWTH: High quality low dd EA using trend grids. Download EA_GROWTHJoin Our Telegram Group
")


