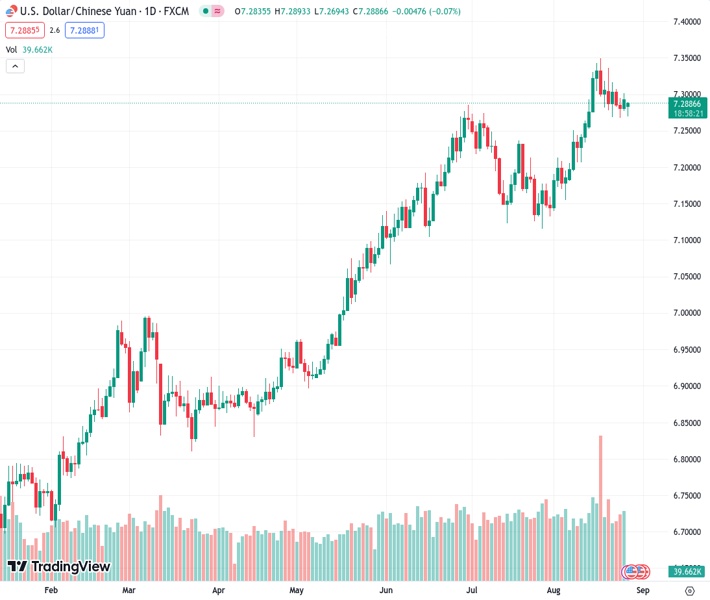
Despite recently bouncing off its intraday low, the USDCNH pair at 7.28773 continues to face pressure today. According to the perspective of @nehcap, there are expectations for further decline.
…
This is a premium post.
[s2If !current_user_can(access_s2member_level4)]Please register for FREE REGISTER to read full post below containing analysis. In case of any error or you think you are not able to read the full post below, please email us at support#nehcap.com [lwa][/s2If] [s2If current_user_can(access_s2member_level1)]
- USD/CNH remains pressured on a day despite recent bouncing off intraday low.
The pair currently trades last at 7.28773.
The previous day high was 7.302 while the previous day low was 7.2804. The daily 38.2% Fib levels comes at 7.2938, expected to provide resistance. Similarly, the daily 61.8% fib level is at 7.2886, expected to provide resistance.
USD/CNH pares intraday losses around 7.2800 as China’s offshore Yuan (CNH) traders seek fresh clues to defend the daily losses during early Monday. In doing so, the Chinese currency cheers the broad pullback in the US Dollar amid a fresh bout of stimulus news from Beijing.
Also read: China cuts stamp duty on stocks trade, posts seventh fall in Industrial Profits as Sino-US talks loom
Technically, the pair’s downbeat break of a one-month-old previous support line joins the repeated failures to cross the 10-DMA immediate hurdle to keep the USD/CNH bears hopeful.
Also, the looming bear cross on the MACD and a downward-sloping RSI (14) line from the overbought territory weigh on the USD/CNH prices.
With this, the quote’s further downside toward the late July swing high of around 7.2370 appears imminent.
However, the 50-DMA and an ascending support line from late March, respectively near 7.2260 and 7.1920, can challenge the USD/CNH bears afterward.
On the contrary, a daily closing beyond the 10-DMA level surrounding 7.3020 can propel the USD/CNH price towards the five-month-old support-turned-resistance line of near 7.3160.
Even so, a horizontal area comprising multiple tops marked since August 16, close to 7.2370-60, can challenge the USD/CNH bulls before refreshing the yearly high.
Trend: Further downside expected
Technical Levels: Supports and Resistances
USDCNH currently trading at 7.2798 at the time of writing. Pair opened at 7.2958 and is trading with a change of -0.22% % .
| Overview | Overview.1 | |
|---|---|---|
| 0 | Today last price | 7.2798 |
| 1 | Today Daily Change | -0.0160 |
| 2 | Today Daily Change % | -0.22% |
| 3 | Today daily open | 7.2958 |
The pair remains strongly bullish on the daily timeframe. It trades above its 20 SMA @ 7.2542, 50 SMA 7.2236, 100 SMA @ 7.1136 and 200 SMA @ 7.0086.
| Trends | Trends.1 | |
|---|---|---|
| 0 | Daily SMA20 | 7.2542 |
| 1 | Daily SMA50 | 7.2236 |
| 2 | Daily SMA100 | 7.1136 |
| 3 | Daily SMA200 | 7.0086 |
The previous day high was 7.302 while the previous day low was 7.2804. The daily 38.2% Fib levels comes at 7.2938, expected to provide resistance. Similarly, the daily 61.8% fib level is at 7.2886, expected to provide resistance.
Note the levels of interest below:
- Pivot support is noted at 7.2835, 7.271, 7.2618
- Pivot resistance is noted at 7.3052, 7.3145, 7.3269
| Levels | Levels.1 |
|---|---|
| Previous Daily High | 7.3020 |
| Previous Daily Low | 7.2804 |
| Previous Weekly High | 7.3362 |
| Previous Weekly Low | 7.2676 |
| Previous Monthly High | 7.2744 |
| Previous Monthly Low | 7.1160 |
| Daily Fibonacci 38.2% | 7.2938 |
| Daily Fibonacci 61.8% | 7.2886 |
| Daily Pivot Point S1 | 7.2835 |
| Daily Pivot Point S2 | 7.2710 |
| Daily Pivot Point S3 | 7.2618 |
| Daily Pivot Point R1 | 7.3052 |
| Daily Pivot Point R2 | 7.3145 |
| Daily Pivot Point R3 | 7.3269 |
[/s2If]
Download Nehcap EAWe have two EAs that are operational on our LIVE accounts.
- EA-FIX: Check out the details here. Download EA-FIX . EA-FIX is a non-grid HFT scalper.
- EA-GROWTH: High quality low dd EA using trend grids. Download EA_GROWTHJoin Our Telegram Group
")


