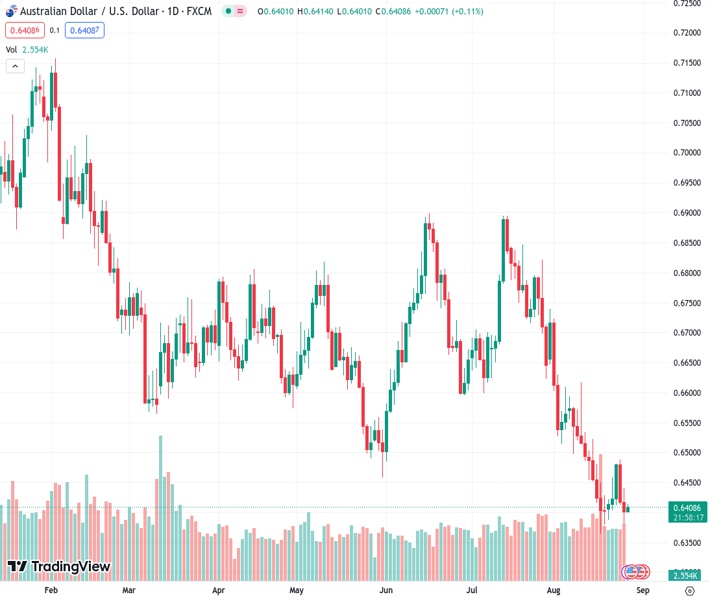
The AUDUSD pair, which is currently at a rate of 0.64121, continues to remain unchanged after just managing to avoid a six-week period of consistent losses.
…
This is a premium post.
[s2If !current_user_can(access_s2member_level4)]Please register for FREE REGISTER to read full post below containing analysis. In case of any error or you think you are not able to read the full post below, please email us at support#nehcap.com [lwa][/s2If] [s2If current_user_can(access_s2member_level1)]
- AUD/USD remains sidelined after barely defending six-week losing streak.
The pair currently trades last at 0.64121.
The previous day high was 0.6442 while the previous day low was 0.638. The daily 38.2% Fib levels comes at 0.6403, expected to provide support. Similarly, the daily 61.8% fib level is at 0.6418, expected to provide resistance.
AUD/USD begins the trading week on a defensive mode around 0.6400 as it justifies the mixed clues surrounding major customer China ahead of top-tier data at home. That said, China’s stimulus and the US-China trade talks contrast with the growing fears of witnessing the economic slowdown in Beijing to confuse the Aussie pair traders, especially amid the pre-data anxiety.
During the weekend, China halved its stamp duty on stock trade to offer another boost to the economic activity after witnessing a seventh consecutive fall in Industrial Profits, down 6.7% in July from a year earlier and -15.5% for the first seven months of 2023 compared to the same period the last year.
It’s worth noting that US Commerce Secretary Gina Raimondo’s visit to Beijing appears flashing positive signs initially as the policymaker seeks trade and tourism boosts in her talks with Chinese authorities, per Reuters.
Elsewhere, Australian Treasurer Jim Chalmers flagged expectations of witnessing substantially weaker Australian growth due to higher interest rates from the Reserve Bank of Australia (RBA) and China’s slowdown.
On a different page, the softer prints of the US Purchasing Managers Index and Michigan Consumer Sentiment Index contrasted with mixed details of Durable Goods Orders, mid-tier activity data and inflation expectations. However, hawkish comments from Federal Reserve (Fed) Chairman Jerome Powell at the annual Jackson Hole Symposium helped the US Dollar Index (DXY) to post the fifth consecutive weekly gain while poking the three-month high.
On Friday, Fed’s Powell reiterated his defense for “higher for longer” rates while stating that the policy is restrictive but the Fed can’t be certain what the neutral rate level is. The policymaker also added that there is substantial further ground to cover to get back to price stability while also stating that the economic uncertainty calls for agile monetary policy-making.
Not only Fed Chair Powell but also President of the Federal Reserve Bank of Cleveland Loretta J. Mester also appeared hawkish while warning that the under-tightening would be worse than overtightening. The policymaker also added, “We are getting close to where we need to be with rates.”
Looking forward, headlines surrounding China can keep entertaining the AUD/USD pair traders while Australia’s Retail Sales for July, expected 0.3% versus -0.8% prior, will be important to watch for intraday directions. However, major attention will be given to this week’s inflation clues from the US and Australia, as well as the US employment report for August.
A downward-sloping support line from early March, around 0.6350 by the press time, restricts the immediate downside of the AUD/USD pair even if a six-week-old falling resistance line, close to 0.6430 by the press time, restricts the Aussie pair’s rebound.
Technical Levels: Supports and Resistances
AUDUSD currently trading at 0.6406 at the time of writing. Pair opened at 0.6404 and is trading with a change of 0.03% % .
| Overview | Overview.1 | |
|---|---|---|
| 0 | Today last price | 0.6406 |
| 1 | Today Daily Change | 0.0002 |
| 2 | Today Daily Change % | 0.03% |
| 3 | Today daily open | 0.6404 |
The pair remains strongly bearish on the daily time frame. It trades below the 20 SMA @ 0.6498, 50 SMA 0.6637, 100 SMA @ 0.6655 and 200 SMA @ 0.6727.
| Trends | Trends.1 | |
|---|---|---|
| 0 | Daily SMA20 | 0.6498 |
| 1 | Daily SMA50 | 0.6637 |
| 2 | Daily SMA100 | 0.6655 |
| 3 | Daily SMA200 | 0.6727 |
The previous day high was 0.6442 while the previous day low was 0.638. The daily 38.2% Fib levels comes at 0.6403, expected to provide support. Similarly, the daily 61.8% fib level is at 0.6418, expected to provide resistance.
Note the levels of interest below:
- Pivot support is noted at 0.6376, 0.6347, 0.6314
- Pivot resistance is noted at 0.6437, 0.647, 0.6499
| Levels | Levels.1 |
|---|---|
| Previous Daily High | 0.6442 |
| Previous Daily Low | 0.6380 |
| Previous Weekly High | 0.6488 |
| Previous Weekly Low | 0.6380 |
| Previous Monthly High | 0.6895 |
| Previous Monthly Low | 0.6599 |
| Daily Fibonacci 38.2% | 0.6403 |
| Daily Fibonacci 61.8% | 0.6418 |
| Daily Pivot Point S1 | 0.6376 |
| Daily Pivot Point S2 | 0.6347 |
| Daily Pivot Point S3 | 0.6314 |
| Daily Pivot Point R1 | 0.6437 |
| Daily Pivot Point R2 | 0.6470 |
| Daily Pivot Point R3 | 0.6499 |
[/s2If]
Download Nehcap EAWe have two EAs that are operational on our LIVE accounts.
- EA-FIX: Check out the details here. Download EA-FIX . EA-FIX is a non-grid HFT scalper.
- EA-GROWTH: High quality low dd EA using trend grids. Download EA_GROWTHJoin Our Telegram Group
")


