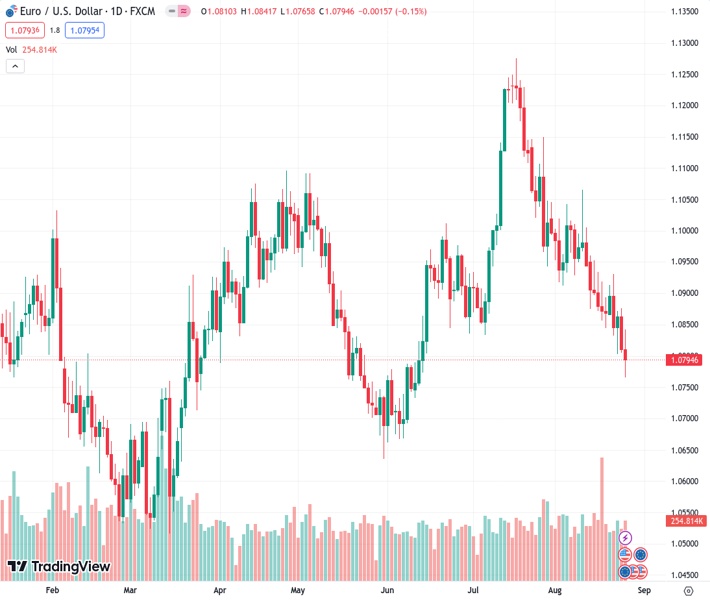
The European Union’s currency against the United States Dollar, with a current value of 1.07941, dropped below the 200-day Simple Moving Average (SMA) at 1.0800 and reached around the 1.0795 level to end the week.
…
This is a premium post.
[s2If !current_user_can(access_s2member_level4)]Please register for FREE REGISTER to read full post below containing analysis. In case of any error or you think you are not able to read the full post below, please email us at support#nehcap.com [lwa][/s2If] [s2If current_user_can(access_s2member_level1)]
- The EUR/USD fell below the 200-day SMA of 1.0800 towards the 1.0795 area to close the week.
The pair currently trades last at 1.07941.
The previous day high was 1.0877 while the previous day low was 1.0805. The daily 38.2% Fib levels comes at 1.0832, expected to provide resistance. Similarly, the daily 61.8% fib level is at 1.0849, expected to provide resistance.
In Friday’s session, the EUR/USD bears broke through the 200-day Simple Moving Average (SMA) of 1.0800, setting a 0.72% weekly loss, its fourth in a row. In addition,the 20 and 100-day SMAs performed a bearish cross, suggesting that further downside may be on the horizon for the pair.
At Jackson Hole, Christine Lagarde, president of the European Central Bank (ECB), didn’t provide any highlights. She stated that the bank is ready to raise as much as possible rates but that a multi-legged approach is needed for effective policy. As for now, ECB expectations remain subdued, mainly driven by poor results shown by the Eurozone and according to the World Interest Rates Probabilities (WIRP), investors bet on 40% and 55% odds of a 25 basis point (bps) hike in the September and October meetings.
Based on the daily chart, it is evident that EUR/USD leans toward a bearish outlook in the short term. Relative Strength Index (RSI) remains below its midline in negative territory, showcasing a southward slope nearing oversold conditions. Similarly, the Moving Average Convergence Divergence (MACD) exhibits red bars, emphasising the strengthening bearish momentum for EUR/USD. On the other hand, the pair is below the 20,100 and 200-day Simple Moving Averages (SMAs), indicating that the sellers now dominate on the broader perspective.
Support levels: 1.0780, 1.0750, 1.0730.
Resistance levels: 1.0800 (200-day SMA), 1.0850, 1.0900.
Technical Levels: Supports and Resistances
EURUSD currently trading at 1.0796 at the time of writing. Pair opened at 1.081 and is trading with a change of -0.13 % .
| Overview | Overview.1 | |
|---|---|---|
| 0 | Today last price | 1.0796 |
| 1 | Today Daily Change | -0.0014 |
| 2 | Today Daily Change % | -0.1300 |
| 3 | Today daily open | 1.0810 |
The pair remains strongly bearish on the daily time frame. It trades below the 20 SMA @ 1.093, 50 SMA 1.098, 100 SMA @ 1.0929 and 200 SMA @ 1.0801.
| Trends | Trends.1 | |
|---|---|---|
| 0 | Daily SMA20 | 1.0930 |
| 1 | Daily SMA50 | 1.0980 |
| 2 | Daily SMA100 | 1.0929 |
| 3 | Daily SMA200 | 1.0801 |
The previous day high was 1.0877 while the previous day low was 1.0805. The daily 38.2% Fib levels comes at 1.0832, expected to provide resistance. Similarly, the daily 61.8% fib level is at 1.0849, expected to provide resistance.
Note the levels of interest below:
- Pivot support is noted at 1.0785, 1.0759, 1.0713
- Pivot resistance is noted at 1.0856, 1.0902, 1.0928
| Levels | Levels.1 |
|---|---|
| Previous Daily High | 1.0877 |
| Previous Daily Low | 1.0805 |
| Previous Weekly High | 1.0960 |
| Previous Weekly Low | 1.0845 |
| Previous Monthly High | 1.1276 |
| Previous Monthly Low | 1.0834 |
| Daily Fibonacci 38.2% | 1.0832 |
| Daily Fibonacci 61.8% | 1.0849 |
| Daily Pivot Point S1 | 1.0785 |
| Daily Pivot Point S2 | 1.0759 |
| Daily Pivot Point S3 | 1.0713 |
| Daily Pivot Point R1 | 1.0856 |
| Daily Pivot Point R2 | 1.0902 |
| Daily Pivot Point R3 | 1.0928 |
[/s2If]
Download Nehcap EAWe have two EAs that are operational on our LIVE accounts.
- EA-FIX: Check out the details here. Download EA-FIX . EA-FIX is a non-grid HFT scalper.
- EA-GROWTH: High quality low dd EA using trend grids. Download EA_GROWTHJoin Our Telegram Group
")


