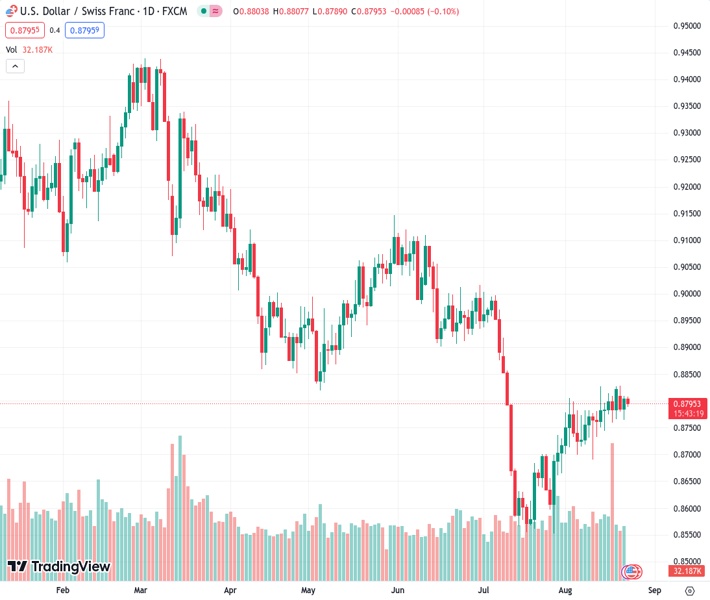
The USDCHF currency pair, currently trading at 0.87955, is seeing a decrease in its rebound from the 100-SMA. Traders are anticipating the release of the US S&P Global PMIs for August. Nehcap’s perspective is that there is not much potential for significant downward movement.
…
This is a premium post.
[s2If !current_user_can(access_s2member_level4)]Please register for FREE REGISTER to read full post below containing analysis. In case of any error or you think you are not able to read the full post below, please email us at support#nehcap.com [lwa][/s2If] [s2If current_user_can(access_s2member_level1)]
- USD/CHF fades bounce off 100-SMA as traders await US S&P Global PMIs for August.
The pair currently trades last at 0.87955.
The previous day high was 0.8809 while the previous day low was 0.8765. The daily 38.2% Fib levels comes at 0.8793, expected to provide support. Similarly, the daily 61.8% fib level is at 0.8782, expected to provide support.
USD/CHF languishes around 0.8800 as it fades the previous day’s rebound from the 100-SMA heading into Wednesday’s European session. In doing so, the Swiss Franc (CHF) pair portrays the market’s cautious mood ahead of the preliminary readings of the August month Purchasing Managers Indexes (PMIs) for the US.
In addition to retreating towards the 100-SMA level of around 0.8780, the steady RSI (14) line and the existence of a 13-day-long rising triangle formation, currently between 0.8770 and 0.8830, also keep the USD/CHF sellers hopeful.
On a clear downside break of the 0.8770 mark, the Swiss Franc (CHF) pair sellers could aim for the 200-SMA support of 0.8720 before rushing toward the theoretical target of the triangle breakdown, around 0.8650.
Meanwhile, USD/CHF rebound needs to cross the top line of the aforementioned triangle, close to 0.8830, to convince intraday buyers.
Even so, the 61.8% Fibonacci retracement of the pair’s late June–July downside, near 0.8840, will act as the final defense of the pair bears.
Overall, the USD/CHF is likely to remain bearish unless crossing 0.8840. However, the downside move should draw support from the softer US S&P Global PMIs for August, as well as dovish Fed concerns, to dominate further.
Trend: Limited downside expected
Technical Levels: Supports and Resistances
USDCHF currently trading at 0.88 at the time of writing. Pair opened at 0.8804 and is trading with a change of -0.05% % .
| Overview | Overview.1 | |
|---|---|---|
| 0 | Today last price | 0.88 |
| 1 | Today Daily Change | -0.0004 |
| 2 | Today Daily Change % | -0.05% |
| 3 | Today daily open | 0.8804 |
The pair is trading above its 20 Daily moving average @ 0.8754, below its 50 Daily moving average @ 0.8805 , below its 100 Daily moving average @ 0.8897 and below its 200 Daily moving average @ 0.9094
| Trends | Trends.1 | |
|---|---|---|
| 0 | Daily SMA20 | 0.8754 |
| 1 | Daily SMA50 | 0.8805 |
| 2 | Daily SMA100 | 0.8897 |
| 3 | Daily SMA200 | 0.9094 |
The previous day high was 0.8809 while the previous day low was 0.8765. The daily 38.2% Fib levels comes at 0.8793, expected to provide support. Similarly, the daily 61.8% fib level is at 0.8782, expected to provide support.
Note the levels of interest below:
- Pivot support is noted at 0.8777, 0.8749, 0.8733
- Pivot resistance is noted at 0.8821, 0.8837, 0.8865
| Levels | Levels.1 |
|---|---|
| Previous Daily High | 0.8809 |
| Previous Daily Low | 0.8765 |
| Previous Weekly High | 0.8828 |
| Previous Weekly Low | 0.8738 |
| Previous Monthly High | 0.9005 |
| Previous Monthly Low | 0.8552 |
| Daily Fibonacci 38.2% | 0.8793 |
| Daily Fibonacci 61.8% | 0.8782 |
| Daily Pivot Point S1 | 0.8777 |
| Daily Pivot Point S2 | 0.8749 |
| Daily Pivot Point S3 | 0.8733 |
| Daily Pivot Point R1 | 0.8821 |
| Daily Pivot Point R2 | 0.8837 |
| Daily Pivot Point R3 | 0.8865 |
[/s2If]
Download Nehcap EAWe have two EAs that are operational on our LIVE accounts.
- EA-FIX: Check out the details here. Download EA-FIX . EA-FIX is a non-grid HFT scalper.
- EA-GROWTH: High quality low dd EA using trend grids. Download EA_GROWTHJoin Our Telegram Group
")


