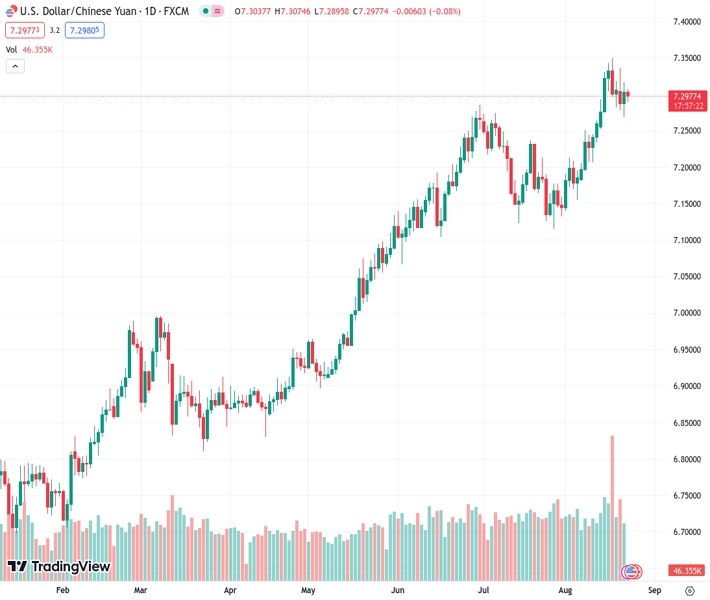
The US Dollar/Chinese Yuan exchange rate is experiencing a decline after briefly rebounding from a support line that has been rising for the past month. This is happening as investors prepare for the release of US Purchasing Managers’ Index (PMI) data. According to the viewpoint of @nehcap, a pullback in the exchange rate is anticipated.
…
This is a premium post.
[s2If !current_user_can(access_s2member_level4)]Please register for FREE REGISTER to read full post below containing analysis. In case of any error or you think you are not able to read the full post below, please email us at support#nehcap.com [lwa][/s2If] [s2If current_user_can(access_s2member_level1)]
- USD/CNH fades bounce off one-month-old rising support line as markets brace for US PMI.
The pair currently trades last at 7.29753.
The previous day high was 7.317 while the previous day low was 7.2692. The daily 38.2% Fib levels comes at 7.2987, expected to provide resistance. Similarly, the daily 61.8% fib level is at 7.2875, expected to provide support.
USD/CNH holds lower grounds near 7.2970 as it pokes a one-month-old support line early Wednesday. In doing so, the offshore Chinese Yuan (CNH) pair reverses the previous day’s corrective bounce amid the market’s consolidation for today’s US PMIs, backed by China-induced cautious optimism.
Also read: S&P500 Futures recover, yields extend pullback from multi-year high as traders brace for PMI amid China hopes
However, the nearly oversold RSI and an impending bear cross on the MACD indicator suggest a pullback in the USD/CNH prices, which in turn allows the pair to break the immediate support line surrounding 7.2850.
Following that, the 50-DMA support 7.2170 acts as the final defense of the USD/CNH buyers before directing the quote towards the 61.8% Fibonacci retracement of October 2022 to January 2023 downside, near 7.1170.
On the other hand, firmer prints of the US PMIs and a blow to the recent recovery in the sentiment may propel the USD/CNH prices, which in turn could resume the pair’s upside towards an ascending resistance line from late December 2022, close to 7.3520 at the latest.
In a case where the USD/CNH traders ignore overbought RSI and the MACD conditions, the Yuan pair will aim for the 15-year high marked in October 2022 around 7.3415.
Trend: Pullback expected
Technical Levels: Supports and Resistances
USDCNH currently trading at 7.2952 at the time of writing. Pair opened at 7.3066 and is trading with a change of -0.16% % .
| Overview | Overview.1 | |
|---|---|---|
| 0 | Today last price | 7.2952 |
| 1 | Today Daily Change | -0.0114 |
| 2 | Today Daily Change % | -0.16% |
| 3 | Today daily open | 7.3066 |
The pair remains strongly bullish on the daily timeframe. It trades above its 20 SMA @ 7.2349, 50 SMA 7.2147, 100 SMA @ 7.1014 and 200 SMA @ 7.0061.
| Trends | Trends.1 | |
|---|---|---|
| 0 | Daily SMA20 | 7.2349 |
| 1 | Daily SMA50 | 7.2147 |
| 2 | Daily SMA100 | 7.1014 |
| 3 | Daily SMA200 | 7.0061 |
The previous day high was 7.317 while the previous day low was 7.2692. The daily 38.2% Fib levels comes at 7.2987, expected to provide resistance. Similarly, the daily 61.8% fib level is at 7.2875, expected to provide support.
Note the levels of interest below:
- Pivot support is noted at 7.2782, 7.2499, 7.2305
- Pivot resistance is noted at 7.3259, 7.3453, 7.3736
| Levels | Levels.1 |
|---|---|
| Previous Daily High | 7.3170 |
| Previous Daily Low | 7.2692 |
| Previous Weekly High | 7.3496 |
| Previous Weekly Low | 7.2580 |
| Previous Monthly High | 7.2744 |
| Previous Monthly Low | 7.1160 |
| Daily Fibonacci 38.2% | 7.2987 |
| Daily Fibonacci 61.8% | 7.2875 |
| Daily Pivot Point S1 | 7.2782 |
| Daily Pivot Point S2 | 7.2499 |
| Daily Pivot Point S3 | 7.2305 |
| Daily Pivot Point R1 | 7.3259 |
| Daily Pivot Point R2 | 7.3453 |
| Daily Pivot Point R3 | 7.3736 |
[/s2If]
Download Nehcap EAWe have two EAs that are operational on our LIVE accounts.
- EA-FIX: Check out the details here. Download EA-FIX . EA-FIX is a non-grid HFT scalper.
- EA-GROWTH: High quality low dd EA using trend grids. Download EA_GROWTHJoin Our Telegram Group
")


