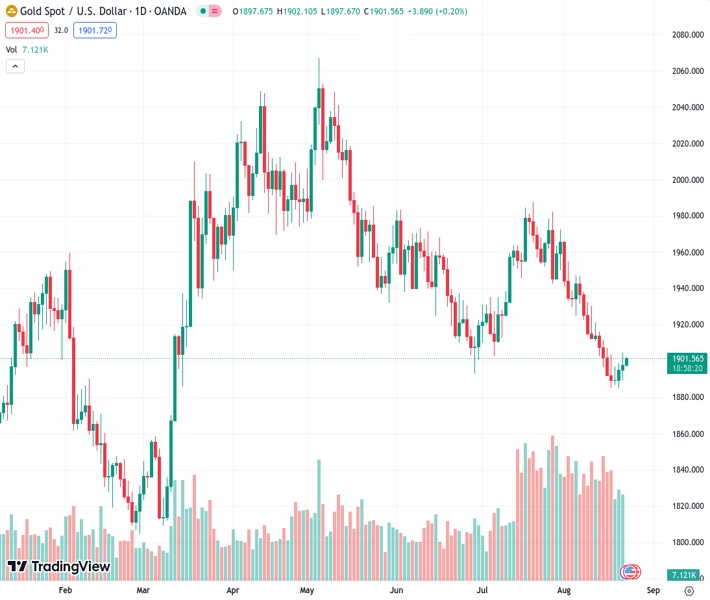
The price of gold, represented as XAUUSD trading at 1,901.50, has increased, but it is facing difficulty in surpassing the $1,900 level.
…
This is a premium post.
[s2If !current_user_can(access_s2member_level4)]Please register for FREE REGISTER to read full post below containing analysis. In case of any error or you think you are not able to read the full post below, please email us at support#nehcap.com [lwa][/s2If] [s2If current_user_can(access_s2member_level1)]
- Gold price trades higher but struggles to surpass the $1,900 mark.
The pair currently trades last at 1901.50.
The previous day high was 1904.51 while the previous day low was 1889.14. The daily 38.2% Fib levels comes at 1898.64, expected to provide support. Similarly, the daily 61.8% fib level is at 1895.01, expected to provide support.
Gold price marginally extends its gains and successfully continues the winning streak for the third day. XAU/USD hovers around $1,900 per troy ounce during the Asian session on Wednesday, showing signs of recovery following four consecutive weeks of losses despite a firmer US Dollar (USD).
However, elevated risk aversion and concerns regarding China’s economy, are exerting pressure on the price of Gold. These elements could potentially impact the overall trajectory of Gold Prices.
Investors’ attention will be on China’s economic woes and financial toil, any signs of further development in fiscal stimulus will be cheered up. According to Reuters, during the BRICS summit in South Africa on Tuesday, Chinese President Xi Jinping said that China’s economy was resilient and that the fundamentals for its long-term growth remained unchanged.
The US Dollar Index (DXY), which measures the performance of the Greenback against the six major currencies, showed resilience on Tuesday and ended the day with a winning point. At the time of writing, the DXY is hovering around 103.50. The decrease in US Treasury yields and downbeat US Existing Home Sales could put the Greenback under pressure.
As said, data released on Tuesday revealed that US Existing Home Sales declined 2.2% in July to an annual rate of 4.07M, against the market consensus of 4.15M. The Richmond Fed Manufacturing Index improved in August from -9 to -7, in line with market expectations. The upcoming Jackson Hole annual symposium holds significant importance, primarily due to the speech by Fed Chair Powell scheduled for Friday.
Traders now look to the US economic docket, featuring preliminary S&P Global Manufacturing PMI for August and New Home Sales Change for July, later during the North American session. These datasets could provide insights, helping for placing fresh bets on the yellow metal.
Technical Levels: Supports and Resistances
XAUUSD currently trading at 1901.62 at the time of writing. Pair opened at 1897.48 and is trading with a change of 0.22 % .
| Overview | Overview.1 | |
|---|---|---|
| 0 | Today last price | 1901.62 |
| 1 | Today Daily Change | 4.14 |
| 2 | Today Daily Change % | 0.22 |
| 3 | Today daily open | 1897.48 |
The pair remains strongly bearish on the daily time frame. It trades below the 20 SMA @ 1923.65, 50 SMA 1932.96, 100 SMA @ 1961.05 and 200 SMA @ 1907.98.
| Trends | Trends.1 | |
|---|---|---|
| 0 | Daily SMA20 | 1923.65 |
| 1 | Daily SMA50 | 1932.96 |
| 2 | Daily SMA100 | 1961.05 |
| 3 | Daily SMA200 | 1907.98 |
The previous day high was 1904.51 while the previous day low was 1889.14. The daily 38.2% Fib levels comes at 1898.64, expected to provide support. Similarly, the daily 61.8% fib level is at 1895.01, expected to provide support.
Note the levels of interest below:
- Pivot support is noted at 1889.58, 1881.67, 1874.21
- Pivot resistance is noted at 1904.95, 1912.41, 1920.32
| Levels | Levels.1 |
|---|---|
| Previous Daily High | 1904.51 |
| Previous Daily Low | 1889.14 |
| Previous Weekly High | 1916.29 |
| Previous Weekly Low | 1885.13 |
| Previous Monthly High | 1987.54 |
| Previous Monthly Low | 1902.77 |
| Daily Fibonacci 38.2% | 1898.64 |
| Daily Fibonacci 61.8% | 1895.01 |
| Daily Pivot Point S1 | 1889.58 |
| Daily Pivot Point S2 | 1881.67 |
| Daily Pivot Point S3 | 1874.21 |
| Daily Pivot Point R1 | 1904.95 |
| Daily Pivot Point R2 | 1912.41 |
| Daily Pivot Point R3 | 1920.32 |
[/s2If]
Download Nehcap EAWe have two EAs that are operational on our LIVE accounts.
- EA-FIX: Check out the details here. Download EA-FIX . EA-FIX is a non-grid HFT scalper.
- EA-GROWTH: High quality low dd EA using trend grids. Download EA_GROWTHJoin Our Telegram Group
")


