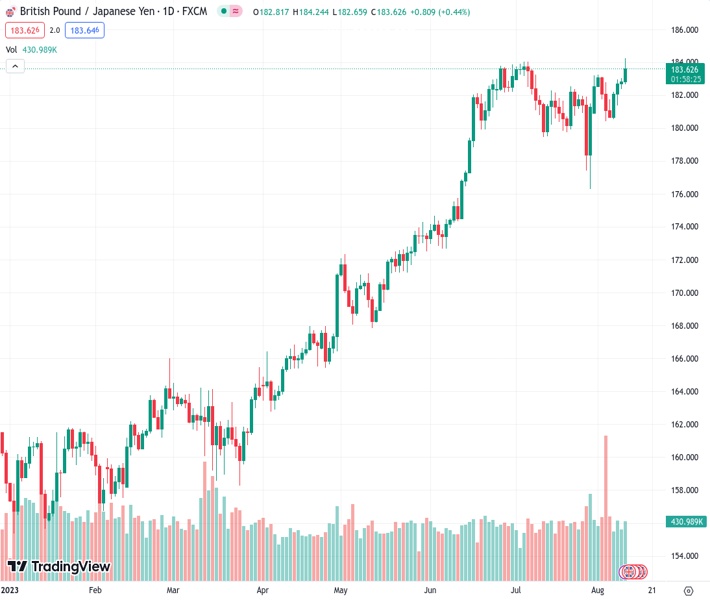
The GBPJPY pair has climbed to a fresh high for the year, surpassing the 184.00 level.
…
This is a premium post.
[s2If !current_user_can(access_s2member_level4)]Please register for FREE REGISTER to read full post below containing analysis. In case of any error or you think you are not able to read the full post below, please email us at support#nehcap.com [lwa][/s2If] [s2If current_user_can(access_s2member_level1)]
- GBP/JPY reached a new YTD high above 184.00.
The pair currently trades last at 183.701.
The previous day high was 183.02 while the previous day low was 182.37. The daily 38.2% Fib levels comes at 182.77, expected to provide support. Similarly, the daily 61.8% fib level is at 182.62, expected to provide support.
Pound Sterling (GBP) extended its gains against the Japanese Yen (JPY) on Thursdays, as the latter weakened as inflation in the United States (US) decelerated, though it triggered a rally in the USD/JPY pair. Consequently, the GBP/JPY printed a new year-to-date (YTD) high of 184.24. At the time of writing, the GBP/JPY exchanges hands at 183.44, up 0.34%.
The GBP/JPY resumed its uptrend, despite dipping towards the 183.40s area as of writing, sponsored by several factors. The Ichimoku Cloud (Kumo) remains below the price action, while the crossover of the Tenkan-Sen above the Kijun-Sen, opened the door for further upside, as seen during Thursday’s session.
For the GBP/JPY to extend its uptrend toward the 185.00 figure, buyers must reclaim 184.00, followed by the YTD high of 184.24. Conversely, if GBP/JPY continues to edge lower and breaks below 183.00, that could exacerbate the pullback. Hence, the GBP/JPY first support would be the Tenkan-Sen at 182.32, followed by a support trendline at around 182.00. Break below will expose the Kumo’s top at 180.60/75, followed by the Kijun-Sen at 180.27.
Technical Levels: Supports and Resistances
GBPJPY currently trading at 183.52 at the time of writing. Pair opened at 182.81 and is trading with a change of 0.39 % .
| Overview | Overview.1 | |
|---|---|---|
| 0 | Today last price | 183.52 |
| 1 | Today Daily Change | 0.71 |
| 2 | Today Daily Change % | 0.39 |
| 3 | Today daily open | 182.81 |
The pair remains strongly bullish on the daily timeframe. It trades above its 20 SMA @ 181.55, 50 SMA 180.47, 100 SMA @ 174.22 and 200 SMA @ 168.43.
| Trends | Trends.1 | |
|---|---|---|
| 0 | Daily SMA20 | 181.55 |
| 1 | Daily SMA50 | 180.47 |
| 2 | Daily SMA100 | 174.22 |
| 3 | Daily SMA200 | 168.43 |
The previous day high was 183.02 while the previous day low was 182.37. The daily 38.2% Fib levels comes at 182.77, expected to provide support. Similarly, the daily 61.8% fib level is at 182.62, expected to provide support.
Note the levels of interest below:
- Pivot support is noted at 182.44, 182.08, 181.79
- Pivot resistance is noted at 183.1, 183.39, 183.75
| Levels | Levels.1 |
|---|---|
| Previous Daily High | 183.02 |
| Previous Daily Low | 182.37 |
| Previous Weekly High | 183.25 |
| Previous Weekly Low | 180.46 |
| Previous Monthly High | 184.02 |
| Previous Monthly Low | 176.32 |
| Daily Fibonacci 38.2% | 182.77 |
| Daily Fibonacci 61.8% | 182.62 |
| Daily Pivot Point S1 | 182.44 |
| Daily Pivot Point S2 | 182.08 |
| Daily Pivot Point S3 | 181.79 |
| Daily Pivot Point R1 | 183.10 |
| Daily Pivot Point R2 | 183.39 |
| Daily Pivot Point R3 | 183.75 |
[/s2If]
Download Nehcap EAWe have two EAs that are operational on our LIVE accounts.
- EA-FIX: Check out the details here. Download EA-FIX . EA-FIX is a non-grid HFT scalper.
- EA-GROWTH: High quality low dd EA using trend grids. Download EA_GROWTHJoin Our Telegram Group
")


