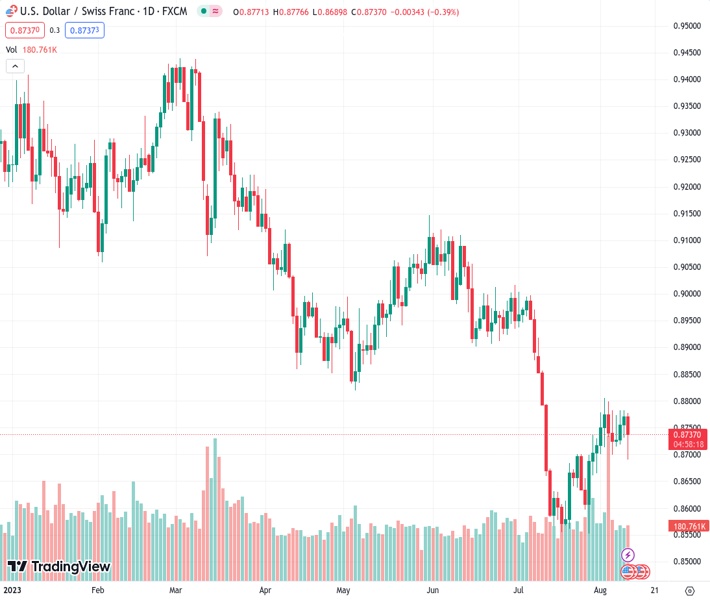
The USDCHF currency pair, which was trading at 0.87362, experiences a decrease in value of 0.43% following the release of US data that indicates a persistent low inflation rate and a slowdown in job market growth.
…
This is a premium post.
[s2If !current_user_can(access_s2member_level4)]Please register for FREE REGISTER to read full post below containing analysis. In case of any error or you think you are not able to read the full post below, please email us at support#nehcap.com [lwa][/s2If] [s2If current_user_can(access_s2member_level1)]
- USD/CHF pulls back from weekly highs, shedding 0.43% after US data points to continued disinflation and a cooling labor market.
The pair currently trades last at 0.87362.
The previous day high was 0.8783 while the previous day low was 0.8732. The daily 38.2% Fib levels comes at 0.8763, expected to provide resistance. Similarly, the daily 61.8% fib level is at 0.8751, expected to provide resistance.
USD/CHF retraces from weekly highs but remains trading sideways within a narrow 40-pip range after a tranche of US economic data indicates the disinflationary process continues while the labor market flashes signs of easing. Hence, the USD/CHF drops 0.43% and changes hands at around 0.8733.
Even though the USD/CHF registers losses, it remains neutrally biased, slightly tilted upwards, as the pair remains trading off the year’s lows of 0.8554. As of writing, after printing a daily low of 0.8689, it reversed its course, with buyers reclaiming the 20-day Exponential Moving Average (EMA) at 0.8737 after testing the last week’s low of 0.8699.
If USD/CHF resumes its uptrend above 0.8782 and conquers 0.8800, that could exacerbate a test of the 50-day EMA at 0.8815. A breach of the latter would expose the 0.8900 mark, followed by the 100-day EMA at 0.8926.
Conversely, a daily close below 0.8700 and the USD/CHF could test the year-to-date (YTD) low of 0.8554.
Technical Levels: Supports and Resistances
USDCHF currently trading at 0.8734 at the time of writing. Pair opened at 0.8772 and is trading with a change of -0.43 % .
| Overview | Overview.1 | |
|---|---|---|
| 0 | Today last price | 0.8734 |
| 1 | Today Daily Change | -0.0038 |
| 2 | Today Daily Change % | -0.4300 |
| 3 | Today daily open | 0.8772 |
The pair is trading above its 20 Daily moving average @ 0.868, below its 50 Daily moving average @ 0.8854 , below its 100 Daily moving average @ 0.893 and below its 200 Daily moving average @ 0.9136
| Trends | Trends.1 | |
|---|---|---|
| 0 | Daily SMA20 | 0.8680 |
| 1 | Daily SMA50 | 0.8854 |
| 2 | Daily SMA100 | 0.8930 |
| 3 | Daily SMA200 | 0.9136 |
The previous day high was 0.8783 while the previous day low was 0.8732. The daily 38.2% Fib levels comes at 0.8763, expected to provide resistance. Similarly, the daily 61.8% fib level is at 0.8751, expected to provide resistance.
Note the levels of interest below:
- Pivot support is noted at 0.8742, 0.8711, 0.8691
- Pivot resistance is noted at 0.8793, 0.8813, 0.8844
| Levels | Levels.1 |
|---|---|
| Previous Daily High | 0.8783 |
| Previous Daily Low | 0.8732 |
| Previous Weekly High | 0.8806 |
| Previous Weekly Low | 0.8665 |
| Previous Monthly High | 0.9005 |
| Previous Monthly Low | 0.8552 |
| Daily Fibonacci 38.2% | 0.8763 |
| Daily Fibonacci 61.8% | 0.8751 |
| Daily Pivot Point S1 | 0.8742 |
| Daily Pivot Point S2 | 0.8711 |
| Daily Pivot Point S3 | 0.8691 |
| Daily Pivot Point R1 | 0.8793 |
| Daily Pivot Point R2 | 0.8813 |
| Daily Pivot Point R3 | 0.8844 |
[/s2If]
Download Nehcap EAWe have two EAs that are operational on our LIVE accounts.
- EA-FIX: Check out the details here. Download EA-FIX . EA-FIX is a non-grid HFT scalper.
- EA-GROWTH: High quality low dd EA using trend grids. Download EA_GROWTHJoin Our Telegram Group
")


