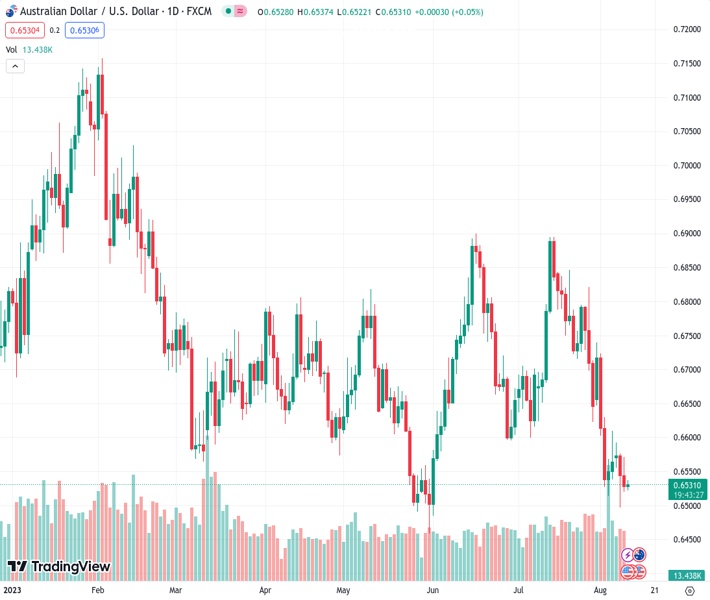
The AUDUSD pair, which reached a high during the day at 0.65294, is now decreasing slightly. This comes after a two-day period of losses, in a day that lacks significant activity or excitement.
…
This is a premium post.
[s2If !current_user_can(access_s2member_level4)]Please register for FREE REGISTER to read full post below containing analysis. In case of any error or you think you are not able to read the full post below, please email us at support#nehcap.com [lwa][/s2If] [s2If current_user_can(access_s2member_level1)]
- AUD/USD eases from intraday high during a lackluster day after two-day losing streak.
The pair currently trades last at 0.65294.
The previous day high was 0.6571 while the previous day low was 0.652. The daily 38.2% Fib levels comes at 0.654, expected to provide resistance. Similarly, the daily 61.8% fib level is at 0.6552, expected to provide resistance.
AUD/USD steps back from intraday high while keeping the early-day sluggish momentum around 0.6530 after Australia inflation clues print a softer outcome for August. In doing so, the Aussie pair also fails to react to the likely US-China tension on the White House order restricting technology investments to Beijing. The reason could be linked to the market’s cautious mood ahead of the US inflation data, per the Consumer Price Index (CPI), for July.
That said, Australia Consumer Inflation Expectations eased to 4.9% from 5.2% prior, which in turn backs the Reserve Bank of Australia’s (RBA) recent pause to the tightening cycle. However, the S&P Global appears a bit hawkish on the RBA and puts a floor under the Aussie pair price. “The key risk is that inflation in Australia is more sticky than expected and the RBA has to hike interest rates more strongly,” said the global rating and research house on Wednesday.
Elsewhere, China’s Commerce Ministry showed grave concerns and marked the rights to take measures in retaliation early Thursday in Asia, per Reuters. The news also quotes China Commerce Ministry as saying, “Hopes that the US will respect laws of market economy and the principle of fair competition.”
Late Wednesday, US President Joe Biden signed the much-awaited bill that allows the US Treasury Department to prohibit or restrict certain US investments in Chinese entities, per Reuters.
It should be noted that the looming economic fears from China, Europe and the UK join the global rating agencies’ crackdown on banks to weigh on the sentiment and the AUD/USD price. On the same line are fears of deflation in China and the market’s doubts about future moves of the major central banks.
Amid these plays, Wall Street closed in the red and the US Treasury bond yields were down while the S&P500 Futures printed mild gains by the press time.
Looking ahead, US CPI and Core CPI for July will be crucial to watch amid looming dovish Fed concerns, which if confirmed can extend the AUD/USD pair’s downside towards the key 0.6480 support.
Also read: US CPI Preview: Forecasts from 10 major banks, monthly pace should hold at 0.2%
Although a nine-month-old rising support line, around 0.6480 by the press time, challenges the AUD/USD bears amid the nearly oversold RSI conditions, a clear downside break of the rising support line from October 2022, now immediate support near 0.6545, favors the pair sellers.
Technical Levels: Supports and Resistances
AUDUSD currently trading at 0.6531 at the time of writing. Pair opened at 0.6528 and is trading with a change of 0.05 % .
| Overview | Overview.1 | |
|---|---|---|
| 0 | Today last price | 0.6531 |
| 1 | Today Daily Change | 0.0003 |
| 2 | Today Daily Change % | 0.0500 |
| 3 | Today daily open | 0.6528 |
The pair remains strongly bearish on the daily time frame. It trades below the 20 SMA @ 0.6696, 50 SMA 0.6703, 100 SMA @ 0.6685 and 200 SMA @ 0.6736.
| Trends | Trends.1 | |
|---|---|---|
| 0 | Daily SMA20 | 0.6696 |
| 1 | Daily SMA50 | 0.6703 |
| 2 | Daily SMA100 | 0.6685 |
| 3 | Daily SMA200 | 0.6736 |
The previous day high was 0.6571 while the previous day low was 0.652. The daily 38.2% Fib levels comes at 0.654, expected to provide resistance. Similarly, the daily 61.8% fib level is at 0.6552, expected to provide resistance.
Note the levels of interest below:
- Pivot support is noted at 0.6508, 0.6488, 0.6457
- Pivot resistance is noted at 0.656, 0.6591, 0.6611
| Levels | Levels.1 |
|---|---|
| Previous Daily High | 0.6571 |
| Previous Daily Low | 0.6520 |
| Previous Weekly High | 0.6740 |
| Previous Weekly Low | 0.6514 |
| Previous Monthly High | 0.6895 |
| Previous Monthly Low | 0.6599 |
| Daily Fibonacci 38.2% | 0.6540 |
| Daily Fibonacci 61.8% | 0.6552 |
| Daily Pivot Point S1 | 0.6508 |
| Daily Pivot Point S2 | 0.6488 |
| Daily Pivot Point S3 | 0.6457 |
| Daily Pivot Point R1 | 0.6560 |
| Daily Pivot Point R2 | 0.6591 |
| Daily Pivot Point R3 | 0.6611 |
[/s2If]
Download Nehcap EAWe have two EAs that are operational on our LIVE accounts.
- EA-FIX: Check out the details here. Download EA-FIX . EA-FIX is a non-grid HFT scalper.
- EA-GROWTH: High quality low dd EA using trend grids. Download EA_GROWTHJoin Our Telegram Group
")


