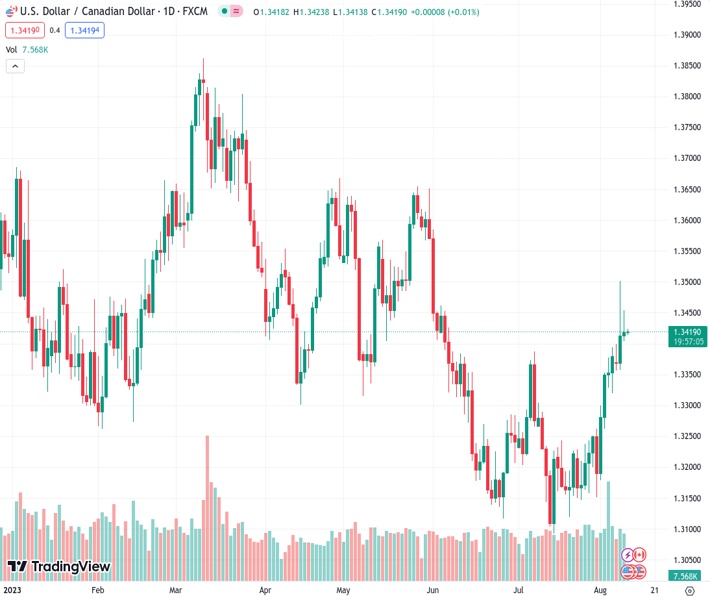
During the early Asian session, the USDCAD currency pair remains relatively stable around the 1.3420 level.
…
This is a premium post.
[s2If !current_user_can(access_s2member_level4)]Please register for FREE REGISTER to read full post below containing analysis. In case of any error or you think you are not able to read the full post below, please email us at support#nehcap.com [lwa][/s2If] [s2If current_user_can(access_s2member_level1)]
- USD/CAD moves sideways near the 1.3420 mark in the early Asian session.
The pair currently trades last at 1.34192.
The previous day high was 1.3454 while the previous day low was 1.3404. The daily 38.2% Fib levels comes at 1.3435, expected to provide resistance. Similarly, the daily 61.8% fib level is at 1.3423, expected to provide resistance.
The USD/CAD pair struggles to gain any meaningful traction during the early Asian session on Thursday. The major pair currently trades near 1.3421, up 0.01% for the day. Market participants prefer to wait on the sidelines ahead of the US top-tier data release. Meanwhile, the US Dollar Index (DXY) trades sideways near 102.50 amid the cautious mood in the market.
On Wednesday, US President Joe Biden issued an executive order about the restriction on China. That said, the US intends to target only Chinese companies that generate more than 50% of their revenue from quantum computation and artificial intelligence (AI).
China’s Commerce Ministry expressed severe worries in response to the US executive order restricting some investments in Chinese technology businesses, according to Reuters. The Chinese authorities added that they hope the US will respect market economic laws and the principle of fair competition. Market players will keep an eye on the developments surrounding the world’s two largest economies.
Furthermore, money market futures do not anticipate higher borrowing rates. According to the CME FedWatch Tool, the markets anticipate an 86.0% chance that the Federal Reserve will pause interest rate hikes at its meeting in September. This, in turn, might cap the upside in the US Dollar and acts as a headwind for the USD/CAD pair
On the other hand, Canadian Building Permits came in at 6.1% MoM in July, better than market expectations of a 3.5% drop. Meanwhile, the uptick in oil prices has supported the Loonie. That said, WTI prices hit a new yearly high on Wednesday, above $84.00. Higher crude prices strengthen the Canadian Dollar, as the country is the leading oil exporter to the United States.
Looking ahead, investors will keep an eye on the US inflation data due later this week. The US Consumer Price Index (CPI) for July will be released on Thursday in the American session. The inflation figure is expected to rise from 3% to 3.3%, and the core inflation figure is expected to stay at 4.8%. Also, the Producer Price Index (PPI) will be due on Friday. The data will be critical for determining a clear movement for the USD/CAD pair.
Technical Levels: Supports and Resistances
USDCAD currently trading at 1.342 at the time of writing. Pair opened at 1.3419 and is trading with a change of 0.01 % .
| Overview | Overview.1 | |
|---|---|---|
| 0 | Today last price | 1.3420 |
| 1 | Today Daily Change | 0.0001 |
| 2 | Today Daily Change % | 0.0100 |
| 3 | Today daily open | 1.3419 |
The pair is trading above its 20 Daily moving average @ 1.3252, above its 50 Daily moving average @ 1.3268 , above its 100 Daily moving average @ 1.3393 and below its 200 Daily moving average @ 1.3452
| Trends | Trends.1 | |
|---|---|---|
| 0 | Daily SMA20 | 1.3252 |
| 1 | Daily SMA50 | 1.3268 |
| 2 | Daily SMA100 | 1.3393 |
| 3 | Daily SMA200 | 1.3452 |
The previous day high was 1.3454 while the previous day low was 1.3404. The daily 38.2% Fib levels comes at 1.3435, expected to provide resistance. Similarly, the daily 61.8% fib level is at 1.3423, expected to provide resistance.
Note the levels of interest below:
- Pivot support is noted at 1.3397, 1.3376, 1.3347
- Pivot resistance is noted at 1.3447, 1.3476, 1.3497
| Levels | Levels.1 |
|---|---|
| Previous Daily High | 1.3454 |
| Previous Daily Low | 1.3404 |
| Previous Weekly High | 1.3394 |
| Previous Weekly Low | 1.3151 |
| Previous Monthly High | 1.3387 |
| Previous Monthly Low | 1.3093 |
| Daily Fibonacci 38.2% | 1.3435 |
| Daily Fibonacci 61.8% | 1.3423 |
| Daily Pivot Point S1 | 1.3397 |
| Daily Pivot Point S2 | 1.3376 |
| Daily Pivot Point S3 | 1.3347 |
| Daily Pivot Point R1 | 1.3447 |
| Daily Pivot Point R2 | 1.3476 |
| Daily Pivot Point R3 | 1.3497 |
[/s2If]
Download Nehcap EAWe have two EAs that are operational on our LIVE accounts.
- EA-FIX: Check out the details here. Download EA-FIX . EA-FIX is a non-grid HFT scalper.
- EA-GROWTH: High quality low dd EA using trend grids. Download EA_GROWTHJoin Our Telegram Group
")


