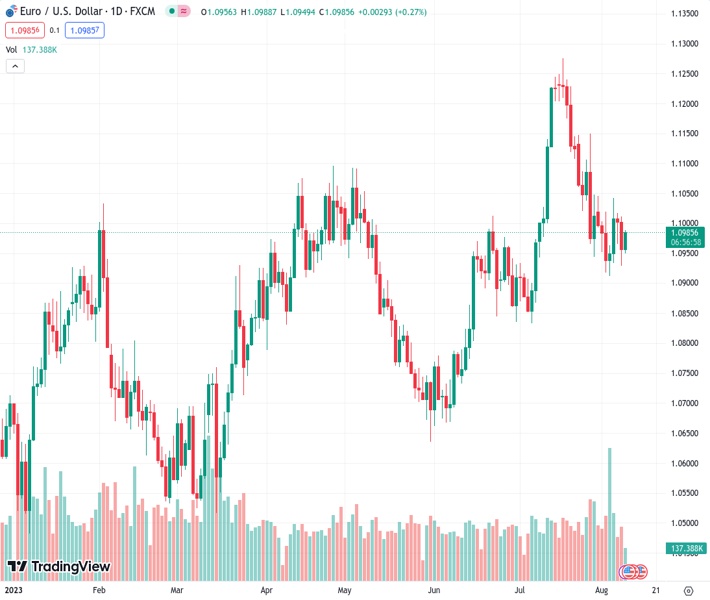
On Wednesday, the EURUSD currency pair at a rate of 1.09806, partially changes direction from its downward movement earlier in the week.
…
This is a premium post.
[s2If !current_user_can(access_s2member_level4)]Please register for FREE REGISTER to read full post below containing analysis. In case of any error or you think you are not able to read the full post below, please email us at support#nehcap.com [lwa][/s2If] [s2If current_user_can(access_s2member_level1)]
- EUR/USD reverses part of the weekly leg lower on Wednesday.
The pair currently trades last at 1.09806.
The previous day high was 1.1011 while the previous day low was 1.0929. The daily 38.2% Fib levels comes at 1.0961, expected to provide support. Similarly, the daily 61.8% fib level is at 1.098, expected to provide support.
EUR/USD regains some composure and bounces to the 1.0990 region on Wednesday.
In case losses accelerate, spot should face interim contention at the 55-day and 100-day SMAs at 1.0930 and 1.0924, respectively, ahead of the so far August low at 1.0912 (August 3). In case the latter is breached on a sustainable way, the pair could embark on a move to the July low of 1.0833 (July 6).
In the meantime, while below the weekly high of 1.1149 (July 27), the pair risks further retracements for the time being.
Looking at the longer run, the positive view remains unchanged while above the 200-day SMA, today at 1.0760.
Technical Levels: Supports and Resistances
EURUSD currently trading at 1.0984 at the time of writing. Pair opened at 1.0956 and is trading with a change of 0.26 % .
| Overview | Overview.1 | |
|---|---|---|
| 0 | Today last price | 1.0984 |
| 1 | Today Daily Change | 39.0000 |
| 2 | Today Daily Change % | 0.2600 |
| 3 | Today daily open | 1.0956 |
The pair is trading below its 20 Daily moving average @ 1.1077, above its 50 Daily moving average @ 1.0947 , above its 100 Daily moving average @ 1.0925 and above its 200 Daily moving average @ 1.0756
| Trends | Trends.1 | |
|---|---|---|
| 0 | Daily SMA20 | 1.1077 |
| 1 | Daily SMA50 | 1.0947 |
| 2 | Daily SMA100 | 1.0925 |
| 3 | Daily SMA200 | 1.0756 |
The previous day high was 1.1011 while the previous day low was 1.0929. The daily 38.2% Fib levels comes at 1.0961, expected to provide support. Similarly, the daily 61.8% fib level is at 1.098, expected to provide support.
Note the levels of interest below:
- Pivot support is noted at 1.092, 1.0884, 1.0838
- Pivot resistance is noted at 1.1002, 1.1048, 1.1084
| Levels | Levels.1 |
|---|---|
| Previous Daily High | 1.1011 |
| Previous Daily Low | 1.0929 |
| Previous Weekly High | 1.1046 |
| Previous Weekly Low | 1.0912 |
| Previous Monthly High | 1.1276 |
| Previous Monthly Low | 1.0834 |
| Daily Fibonacci 38.2% | 1.0961 |
| Daily Fibonacci 61.8% | 1.0980 |
| Daily Pivot Point S1 | 1.0920 |
| Daily Pivot Point S2 | 1.0884 |
| Daily Pivot Point S3 | 1.0838 |
| Daily Pivot Point R1 | 1.1002 |
| Daily Pivot Point R2 | 1.1048 |
| Daily Pivot Point R3 | 1.1084 |
[/s2If]
Download Nehcap EAWe have two EAs that are operational on our LIVE accounts.
- EA-FIX: Check out the details here. Download EA-FIX . EA-FIX is a non-grid HFT scalper.
- EA-GROWTH: High quality low dd EA using trend grids. Download EA_GROWTHJoin Our Telegram Group
")


