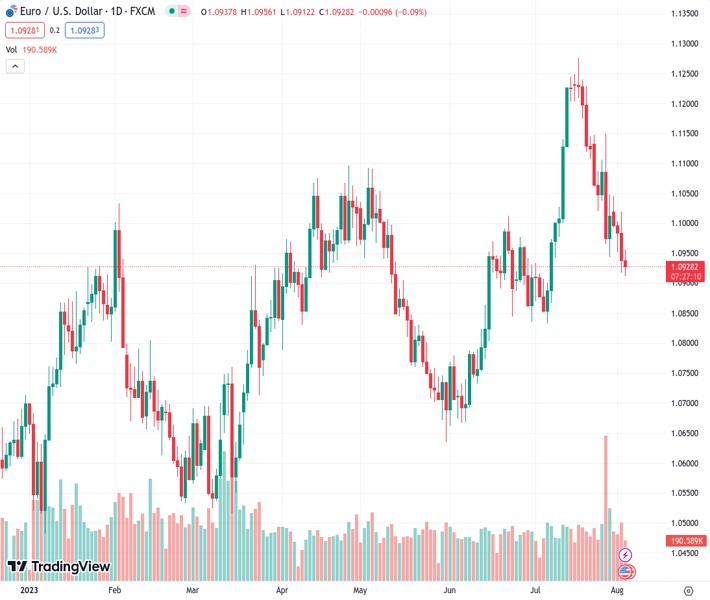
There seems to be some resistance at the level of 1.0910 for the EURUSD pair, which is currently at 1.09287.
…
This is a premium post.
[s2If !current_user_can(access_s2member_level4)]Please register for FREE REGISTER to read full post below containing analysis. In case of any error or you think you are not able to read the full post below, please email us at support#nehcap.com [lwa][/s2If] [s2If current_user_can(access_s2member_level1)]
- EUR/USD appear to have met some contention around 1.0910.
The pair currently trades last at 1.09287.
The previous day high was 1.102 while the previous day low was 1.0918. The daily 38.2% Fib levels comes at 1.0957, expected to provide resistance. Similarly, the daily 61.8% fib level is at 1.0981, expected to provide resistance.
The selling pressure around EUR/USD remains everything but abated on Thursday, as this time the pair visits new multi-week lows around 1.0910.
Considering the ongoing price action, spot risks more sustained losses once 1.0900 is cleared. Against that, the pair could then challenge the July low of 1.0833 (July 6) sooner rather than later.
A deeper retracement from here should put a potential test of the key 200-day SMA at 1.0737 back on the radar, although this scenario remains out of favour for the time being.
Looking at the longer run, the positive view remains unchanged while above the 200-day SMA.
Technical Levels: Supports and Resistances
EURUSD currently trading at 1.0926 at the time of writing. Pair opened at 1.0938 and is trading with a change of -0.11 % .
| Overview | Overview.1 | |
|---|---|---|
| 0 | Today last price | 1.0926 |
| 1 | Today Daily Change | 44.0000 |
| 2 | Today Daily Change % | -0.1100 |
| 3 | Today daily open | 1.0938 |
The pair is trading below its 20 Daily moving average @ 1.1074, below its 50 Daily moving average @ 1.0926 , above its 100 Daily moving average @ 1.0913 and above its 200 Daily moving average @ 1.0734
| Trends | Trends.1 | |
|---|---|---|
| 0 | Daily SMA20 | 1.1074 |
| 1 | Daily SMA50 | 1.0926 |
| 2 | Daily SMA100 | 1.0913 |
| 3 | Daily SMA200 | 1.0734 |
The previous day high was 1.102 while the previous day low was 1.0918. The daily 38.2% Fib levels comes at 1.0957, expected to provide resistance. Similarly, the daily 61.8% fib level is at 1.0981, expected to provide resistance.
Note the levels of interest below:
- Pivot support is noted at 1.0898, 1.0857, 1.0796
- Pivot resistance is noted at 1.1, 1.1061, 1.1102
| Levels | Levels.1 |
|---|---|
| Previous Daily High | 1.1020 |
| Previous Daily Low | 1.0918 |
| Previous Weekly High | 1.1150 |
| Previous Weekly Low | 1.0944 |
| Previous Monthly High | 1.1276 |
| Previous Monthly Low | 1.0834 |
| Daily Fibonacci 38.2% | 1.0957 |
| Daily Fibonacci 61.8% | 1.0981 |
| Daily Pivot Point S1 | 1.0898 |
| Daily Pivot Point S2 | 1.0857 |
| Daily Pivot Point S3 | 1.0796 |
| Daily Pivot Point R1 | 1.1000 |
| Daily Pivot Point R2 | 1.1061 |
| Daily Pivot Point R3 | 1.1102 |
[/s2If]
Download Nehcap EAWe have two EAs that are operational on our LIVE accounts.
- EA-FIX: Check out the details here. Download EA-FIX . EA-FIX is a non-grid HFT scalper.
- EA-GROWTH: High quality low dd EA using trend grids. Download EA_GROWTHJoin Our Telegram Group
")


