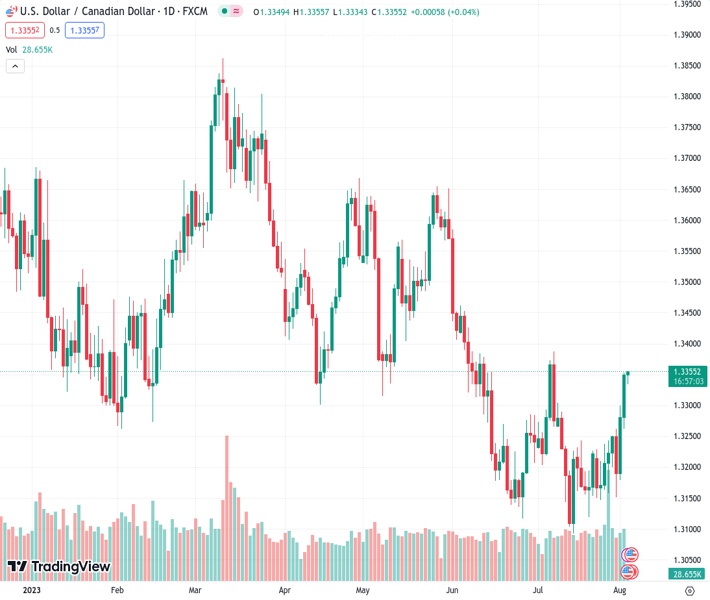
The USDCAD pair, currently at 1.33529, remains strong and close to a peak reached in the Asian session on Thursday, which has been sustained for several weeks.
…
This is a premium post.
[s2If !current_user_can(access_s2member_level4)]Please register for FREE REGISTER to read full post below containing analysis. In case of any error or you think you are not able to read the full post below, please email us at support#nehcap.com [lwa][/s2If] [s2If current_user_can(access_s2member_level1)]
- USD/CAD stands tall near a multi-week peak touched during the Aaisn session on Thursday.
The pair currently trades last at 1.33529.
The previous day high was 1.3354 while the previous day low was 1.3266. The daily 38.2% Fib levels comes at 1.332, expected to provide support. Similarly, the daily 61.8% fib level is at 1.3299, expected to provide support.
The USD/CAD pair is seen consolidating its recent strong gains to a four-week high and oscillating in a narrow band around mid-1.3300s through the Asian session on Thursday.
The US Dollar (USD) stands tall near its highest level since July 7 touched on Wednesday as investors now seem convinced that the Federal Reserve (Fed) will stick to its hawkish stance. Despite the Fitch downgrade of the US credit rating, the incoming upbeat US macro data points to an extremely resilient economy and should allow the Fed to keep interest rates higher for longer. In fact, the US ADP report showed on Wednesday that private-sector employers added 324K jobs in July as compared to the 189K expected. This comes on the back of the upbeat US GDP print released last week and reaffirms market bets for further policy tightening by the Fed. The outlook remains supportive of elevated US Treasury bond yields, which continue to act as a tailwind for the buck and lends some support to the USD/CAD pair.
A stronger USD, meanwhile, offsets the optimism over data showing a substantial drop in US oil inventories over the past week and keeps the black liquid on the defensive for the second successive day. It is worth recalling that the official data showed that US crude inventories shrank by over 17 million barrels during the week to July 28, marking the biggest drawdown recorded since 1982. This indicates a substantial tightening in the markets, albeit does little to lend any support to Crude Oil prices. This, in turn, is seen undermining the commodity-linked Loonie and offering additional support to the USD/CAD pair. Moreover, the overnight move back above the 50-day Simple Moving Average (SMA), for the first time since early June, suggests that the path of least resistance for spot prices is to the upside.
Moving ahead, traders now look forward to the US economic docket – featuring the release of the usual Weekly Initial Jobless Claims, the ISM Services PMI and Factory Orders later during the early North American session. This, along with the US bond yields and the broader risk sentiment, will drive demand for the safe-haven buck and provide some impetus to the USD/CAD pair. Apart from this, Oil price dynamics should contribute to producing short-term trading opportunities. The focus, however, remains on the crucial monthly employment details from the US – popularly known as the NFP report – and Canada on Friday.
Technical Levels: Supports and Resistances
USDCAD currently trading at 1.3354 at the time of writing. Pair opened at 1.335 and is trading with a change of 0.03 % .
| Overview | Overview.1 | |
|---|---|---|
| 0 | Today last price | 1.3354 |
| 1 | Today Daily Change | 0.0004 |
| 2 | Today Daily Change % | 0.0300 |
| 3 | Today daily open | 1.3350 |
The pair is trading above its 20 Daily moving average @ 1.3222, above its 50 Daily moving average @ 1.329 , below its 100 Daily moving average @ 1.3409 and below its 200 Daily moving average @ 1.3458
| Trends | Trends.1 | |
|---|---|---|
| 0 | Daily SMA20 | 1.3222 |
| 1 | Daily SMA50 | 1.3290 |
| 2 | Daily SMA100 | 1.3409 |
| 3 | Daily SMA200 | 1.3458 |
The previous day high was 1.3354 while the previous day low was 1.3266. The daily 38.2% Fib levels comes at 1.332, expected to provide support. Similarly, the daily 61.8% fib level is at 1.3299, expected to provide support.
Note the levels of interest below:
- Pivot support is noted at 1.3293, 1.3236, 1.3205
- Pivot resistance is noted at 1.3381, 1.3411, 1.3469
| Levels | Levels.1 |
|---|---|
| Previous Daily High | 1.3354 |
| Previous Daily Low | 1.3266 |
| Previous Weekly High | 1.3255 |
| Previous Weekly Low | 1.3147 |
| Previous Monthly High | 1.3387 |
| Previous Monthly Low | 1.3093 |
| Daily Fibonacci 38.2% | 1.3320 |
| Daily Fibonacci 61.8% | 1.3299 |
| Daily Pivot Point S1 | 1.3293 |
| Daily Pivot Point S2 | 1.3236 |
| Daily Pivot Point S3 | 1.3205 |
| Daily Pivot Point R1 | 1.3381 |
| Daily Pivot Point R2 | 1.3411 |
| Daily Pivot Point R3 | 1.3469 |
[/s2If]
Download Nehcap EAWe have two EAs that are operational on our LIVE accounts.
- EA-FIX: Check out the details here. Download EA-FIX . EA-FIX is a non-grid HFT scalper.
- EA-GROWTH: High quality low dd EA using trend grids. Download EA_GROWTHJoin Our Telegram Group
")


