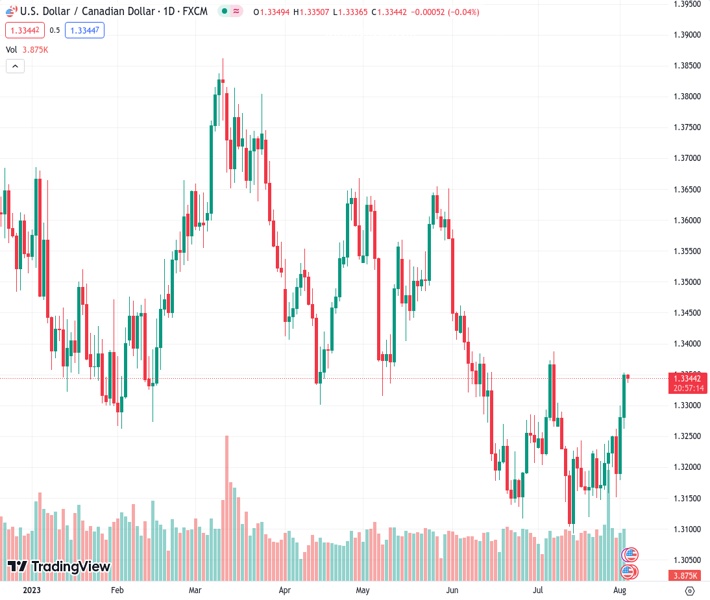
The current exchange rate for USDCAD is 1.33434.
…
This is a premium post.
[s2If !current_user_can(access_s2member_level4)]Please register for FREE REGISTER to read full post below containing analysis. In case of any error or you think you are not able to read the full post below, please email us at support#nehcap.com [lwa][/s2If] [s2If current_user_can(access_s2member_level1)]
The pair currently trades last at 1.33434.
The previous day high was 1.33 while the previous day low was 1.3184. The daily 38.2% Fib levels comes at 1.3256, expected to provide support. Similarly, the daily 61.8% fib level is at 1.3229, expected to provide support.
The USD/CAD pair consolidates its recent gains around 1.3345 during the early Asian session on Thursday. The major pair is on track for its sixth weekly close above 1.3200. Lower Oil prices are the main driver of the Canadian Dollar’s depreciation.
On Wednesday, Automatic Data Processing Inc. (ADP) revealed that the number of employed people in the US private sector rose by 324K, above estimates of 189K and lower than the revised reading of 455,000 in June. This figure is above the 12-month average. The employment data could convince the Federal Reserve (Fed) to hike additional rates this year, which benefits the US Dollar and acts as a tailwind for the USD/CAD pair.
On the Canadian Dollar front, investors await the Canadian Employment Change on Friday as it could offer hints into the strength of domestic activity and the direction of the BoC’s monetary policy.
Earlier this week, Canada’s manufacturing sector declined for the third consecutive month in July. The S&P Global Canada Manufacturing PMI rose to 49.6. This figure followed the previous month’s 48.8 and was better than expected at 48.9. A reading below 50 indicates sector contraction. It has been below that level since May. Meanwhile, a decrease in oil prices has undermined the Loonie since Canada is the largest oil exporter to the United States.
Market participants will keep an eye on the US weekly Jobless Claims, Unit Labour Costs and ISM Service PMI later in the American session. On Friday, attention will shift to Canadian Employment Change and Nonfarm payrolls. The US economy is expected to have created 180,000 jobs. While economists forecast that the Canadian economy will create 21,100 jobs in July. The data will be critical for determining a clear movement for the USD/CAD pair.
Technically, the further upside appears favorable for USD/CAD as the Relative Strength Index (RSI) stands above 50 on the one-hour chart. The immediate resistance level is seen at 1.3385 (High of June 6) and the initial support level appears at 1.3300 (a psychological round mark).
Technical Levels: Supports and Resistances
USDCAD currently trading at 1.3346 at the time of writing. Pair opened at 1.3282 and is trading with a change of 0.48 % .
| Overview | Overview.1 | |
|---|---|---|
| 0 | Today last price | 1.3346 |
| 1 | Today Daily Change | 0.0064 |
| 2 | Today Daily Change % | 0.4800 |
| 3 | Today daily open | 1.3282 |
The pair is trading above its 20 Daily moving average @ 1.3218, above its 50 Daily moving average @ 1.3295 , below its 100 Daily moving average @ 1.3414 and below its 200 Daily moving average @ 1.3459
| Trends | Trends.1 | |
|---|---|---|
| 0 | Daily SMA20 | 1.3218 |
| 1 | Daily SMA50 | 1.3295 |
| 2 | Daily SMA100 | 1.3414 |
| 3 | Daily SMA200 | 1.3459 |
The previous day high was 1.33 while the previous day low was 1.3184. The daily 38.2% Fib levels comes at 1.3256, expected to provide support. Similarly, the daily 61.8% fib level is at 1.3229, expected to provide support.
Note the levels of interest below:
- Pivot support is noted at 1.321, 1.314, 1.3095
- Pivot resistance is noted at 1.3326, 1.3371, 1.3442
| Levels | Levels.1 |
|---|---|
| Previous Daily High | 1.3300 |
| Previous Daily Low | 1.3184 |
| Previous Weekly High | 1.3255 |
| Previous Weekly Low | 1.3147 |
| Previous Monthly High | 1.3387 |
| Previous Monthly Low | 1.3093 |
| Daily Fibonacci 38.2% | 1.3256 |
| Daily Fibonacci 61.8% | 1.3229 |
| Daily Pivot Point S1 | 1.3210 |
| Daily Pivot Point S2 | 1.3140 |
| Daily Pivot Point S3 | 1.3095 |
| Daily Pivot Point R1 | 1.3326 |
| Daily Pivot Point R2 | 1.3371 |
| Daily Pivot Point R3 | 1.3442 |
[/s2If]
Download Nehcap EAWe have two EAs that are operational on our LIVE accounts.
- EA-FIX: Check out the details here. Download EA-FIX . EA-FIX is a non-grid HFT scalper.
- EA-GROWTH: High quality low dd EA using trend grids. Download EA_GROWTHJoin Our Telegram Group
")


