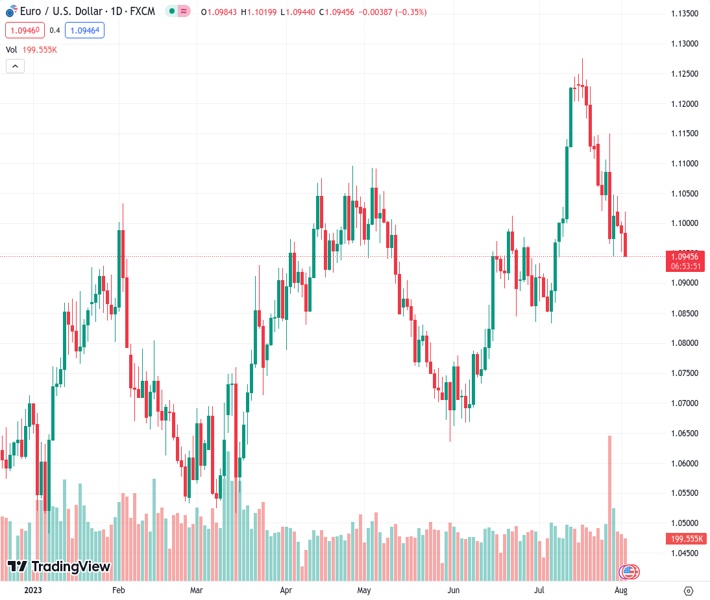
The EURUSD pair, which is currently trading at 1.09478, continues its downward movement for the week and returns to the level of 1.0950.
…
This is a premium post.
[s2If !current_user_can(access_s2member_level4)]Please register for FREE REGISTER to read full post below containing analysis. In case of any error or you think you are not able to read the full post below, please email us at support#nehcap.com [lwa][/s2If] [s2If current_user_can(access_s2member_level1)]
- EUR/USD adds to the weekly leg lower and revisits 1.0950.
The pair currently trades last at 1.09478.
The previous day high was 1.1003 while the previous day low was 1.0952. The daily 38.2% Fib levels comes at 1.0972, expected to provide resistance. Similarly, the daily 61.8% fib level is at 1.0984, expected to provide resistance.
EUR/USD comes under intense selling pressure and flirts once again with weekly lows in the mid-1.0900s on Wednesday.
Considering the ongoing price action, spot could see its downside momentum accelerate and retest the weekly low of 1.0943 (July 28). The breakdown of this region could put a test of the 1.0910 zone, where the transitory 55-day and 100-day SMAs coincide, back on the radar.
Looking at the longer run, the positive view remains unchanged while above the 200-day SMA, today at 1.0733.
Technical Levels: Supports and Resistances
EURUSD currently trading at 1.0962 at the time of writing. Pair opened at 1.0985 and is trading with a change of -0.21 % .
| Overview | Overview.1 | |
|---|---|---|
| 0 | Today last price | 1.0962 |
| 1 | Today Daily Change | 66.0000 |
| 2 | Today Daily Change % | -0.2100 |
| 3 | Today daily open | 1.0985 |
The pair is trading below its 20 Daily moving average @ 1.107, above its 50 Daily moving average @ 1.0923 , above its 100 Daily moving average @ 1.091 and above its 200 Daily moving average @ 1.073
| Trends | Trends.1 | |
|---|---|---|
| 0 | Daily SMA20 | 1.1070 |
| 1 | Daily SMA50 | 1.0923 |
| 2 | Daily SMA100 | 1.0910 |
| 3 | Daily SMA200 | 1.0730 |
The previous day high was 1.1003 while the previous day low was 1.0952. The daily 38.2% Fib levels comes at 1.0972, expected to provide resistance. Similarly, the daily 61.8% fib level is at 1.0984, expected to provide resistance.
Note the levels of interest below:
- Pivot support is noted at 1.0957, 1.0929, 1.0906
- Pivot resistance is noted at 1.1008, 1.1031, 1.1058
| Levels | Levels.1 |
|---|---|
| Previous Daily High | 1.1003 |
| Previous Daily Low | 1.0952 |
| Previous Weekly High | 1.1150 |
| Previous Weekly Low | 1.0944 |
| Previous Monthly High | 1.1276 |
| Previous Monthly Low | 1.0834 |
| Daily Fibonacci 38.2% | 1.0972 |
| Daily Fibonacci 61.8% | 1.0984 |
| Daily Pivot Point S1 | 1.0957 |
| Daily Pivot Point S2 | 1.0929 |
| Daily Pivot Point S3 | 1.0906 |
| Daily Pivot Point R1 | 1.1008 |
| Daily Pivot Point R2 | 1.1031 |
| Daily Pivot Point R3 | 1.1058 |
[/s2If]
Download Nehcap EAWe have two EAs that are operational on our LIVE accounts.
- EA-FIX: Check out the details here. Download EA-FIX . EA-FIX is a non-grid HFT scalper.
- EA-GROWTH: High quality low dd EA using trend grids. Download EA_GROWTHJoin Our Telegram Group
")


