#XAUUSD @ 1,960.08 Gold Price jostles with support-turned-resistance after posting the first weekly loss in four., @nehcap view: Limited upside expected
…
This is a premium post.
[s2If !current_user_can(access_s2member_level4)]Please register for FREE REGISTER to read full post below containing analysis. In case of any error or you think you are not able to read the full post below, please email us at support#nehcap.com [lwa][/s2If] [s2If current_user_can(access_s2member_level1)]
- Gold Price jostles with support-turned-resistance after posting the first weekly loss in four.
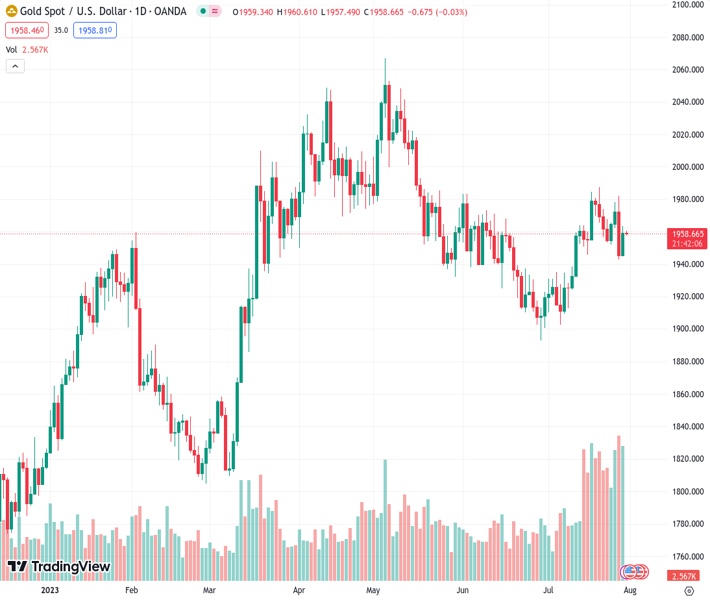
The pair currently trades last at 1960.08.
The previous day high was 1963.56 while the previous day low was 1945.5. The daily 38.2% Fib levels comes at 1956.66, expected to provide support. Similarly, the daily 61.8% fib level is at 1952.4, expected to provide support.
Gold Price (XAU/USD) holds onto Friday’s recovery from more than a two-week low while picking up bids to $1,960 amid the early hours of Asian morning on Monday. In doing so, the XAU/USD justifies Friday’s downbeat US inflation clues and justifies weekend headlines from China, as well as dovish comments from Federal Reserve (Fed) Bank of Minneapolis President Neel Kashkari. That said, the XAU/USD marked the first weekly loss in four after the US Dollar cheered upbeat United States growth data, as well as the Fed’s readiness for a September rate hike.
Gold Price licks its wounds after snapping a three-week uptrend as weekend headlines from China and comments from Federal Reserve Bank of Minneapolis President Neel Kashkari prod the US Dollar bulls and allow the market sentiment to remain firmer.
That said, China’s State Council Information Office conveyed a surprise press conference by Vice Chairman of the National Development and Reform Commission Li Chunlin and officials from the Ministry of Industry and Information Technology, the Ministry of Commerce and the State Administration for Market Regulation to unveil more measures to boost the consumption per Bloomberg.
On the other hand, Federal Reserve Bank of Minneapolis President Neel Kashkari flagged fears of job losses and slower growth while praising the inflation outlook. The policymaker also criticized the central bank’s aggressive monetary tightening campaign to tamp down price surges.
Considering China’s status as one of the world’s biggest Gold consumers and the Federal Reserve’s (Fed) indecision about future rate hikes, the latest headlines put a floor under the XAU/USD price, at least for the short term.
During the last week, upbeat United States data and the European Central Bank’s (ECB) dovish hike propelled the US Dollar and weighed on the Gold price, despite Friday’s corrective bounce due to the softer inflation clues from the US.
That said, the US Federal Reserve’s (Fed) favorite inflation gauge, namely the Core Personal Consumption Expenditure (PCE) Price Index, came in 4.1% YoY for June versus 4.2% expected and 4.6% prior. Further details revealed that the Personal Income softened to 0.3% versus 0.5% expected and previous readings whereas the Personal Spending rose 0.5% from 0.4% market forecasts and 0.1% prior. Additionally, the final readings of the Michigan Consumer Sentiment Index for July eased to 71.6 from the initial estimations of 72.6 while the University of Michigan’s (UoM) 5-year Consumer Inflation Expectations also edged lower to 3.0% from 3.1% expected and prior.
That said, strong prints of the US Gross Domestic Product (GDP) Annualized for the second quarter (Q2) joined the upbeat figures of the US Durable Goods Orders for June to allow the US Dollar to stay firmer for the second consecutive week. Also likely to have favored the US Dollar, is the European Central Bank’s (ECB) dovish hike and emphasis on the data-dependency of the next rate decision.
Amid these plays, Wall Street closed positive and the yields retreated together with the US Dollar. Even so, the US Dollar Index (DXY) marked two consecutive weekly gains by the end of Friday’s trading. It’s worth noting that the S&P500 Futures print mild gains by the press time.
Although the latest headlines have been impressive for Gold buyers, China’s official PMIs for July will entertain intraday traders of the XAU/USD. However, major attention will be given to the United States ISM PMI and Nonfarm Payrolls (NFP) data for July.
Also read: Gold Price Weekly Forecast: US jobs report could help XAU/USD finally find direction
Gold Price broke a one-month-old rising support line, now immediate resistance near $1,963, and helped bears cheer the first weekly loss in four. However, the 200-SMA joined the oversold conditions of the Relative Strength Index (RSI) line, placed at 14, to trigger the metal’s corrective bounce afterward.
However, the recovery moves also gain support from an impending bull cross on the Moving Average Convergence and Divergence (MACD) indicator.
Even so, a clear upside break of the aforementioned support-turned-resistance surrounding $1,960-65 becomes necessary to convince the Gold buyers.
Following that, a 10-week-old horizontal resistance of around $1,985 will act as the final defense of the XAU/USD bears.
On the contrary, the Gold Price pullback remains elusive beyond the 200-SMA level of near $1,942.
In a case where the XAU/USD remains bearish past $1,942, multiple levels around $1,930 and $1,900 round figure may test the Gold bears before directing them to the previous monthly low of around $1,893.
Overall, Gold Price lacks bullish bias but the bears need validation from $1,942 to retake control.
Trend: Limited upside expected
Technical Levels: Supports and Resistances
XAUUSD currently trading at 1960.08 at the time of writing. Pair opened at 1959.5 and is trading with a change of 0.03% % .
| Overview | Overview.1 | |
|---|---|---|
| 0 | Today last price | 1960.08 |
| 1 | Today Daily Change | 0.58 |
| 2 | Today Daily Change % | 0.03% |
| 3 | Today daily open | 1959.5 |
The pair is trading above its 20 Daily moving average @ 1948.39, above its 50 Daily moving average @ 1946.6 , below its 100 Daily moving average @ 1967.14 and above its 200 Daily moving average @ 1887.74
| Trends | Trends.1 | |
|---|---|---|
| 0 | Daily SMA20 | 1948.39 |
| 1 | Daily SMA50 | 1946.60 |
| 2 | Daily SMA100 | 1967.14 |
| 3 | Daily SMA200 | 1887.74 |
The previous day high was 1963.56 while the previous day low was 1945.5. The daily 38.2% Fib levels comes at 1956.66, expected to provide support. Similarly, the daily 61.8% fib level is at 1952.4, expected to provide support.
Note the levels of interest below:
- Pivot support is noted at 1948.81, 1938.13, 1930.75
- Pivot resistance is noted at 1966.87, 1974.25, 1984.93
| Levels | Levels.1 |
|---|---|
| Previous Daily High | 1963.56 |
| Previous Daily Low | 1945.50 |
| Previous Weekly High | 1982.20 |
| Previous Weekly Low | 1942.65 |
| Previous Monthly High | 1983.50 |
| Previous Monthly Low | 1893.01 |
| Daily Fibonacci 38.2% | 1956.66 |
| Daily Fibonacci 61.8% | 1952.40 |
| Daily Pivot Point S1 | 1948.81 |
| Daily Pivot Point S2 | 1938.13 |
| Daily Pivot Point S3 | 1930.75 |
| Daily Pivot Point R1 | 1966.87 |
| Daily Pivot Point R2 | 1974.25 |
| Daily Pivot Point R3 | 1984.93 |
[/s2If]
Download Nehcap EAWe have two EAs that are operational on our LIVE accounts.
- EA-FIX: Check out the details here. Download EA-FIX . EA-FIX is a non-grid HFT scalper.
- EA-GROWTH: High quality low dd EA using trend grids. Download EA_GROWTHJoin Our Telegram Group
")


