The momentum for the USDCAD pair weakens after the Federal Reserve (Fed) meeting.
…
This is a premium post.
[s2If !current_user_can(access_s2member_level4)]Please register for FREE REGISTER to read full post below containing analysis. In case of any error or you think you are not able to read the full post below, please email us at support#nehcap.com [lwa][/s2If] [s2If current_user_can(access_s2member_level1)]
- USD/CAD loses momentum following the Federal Reserve (Fed) meeting.
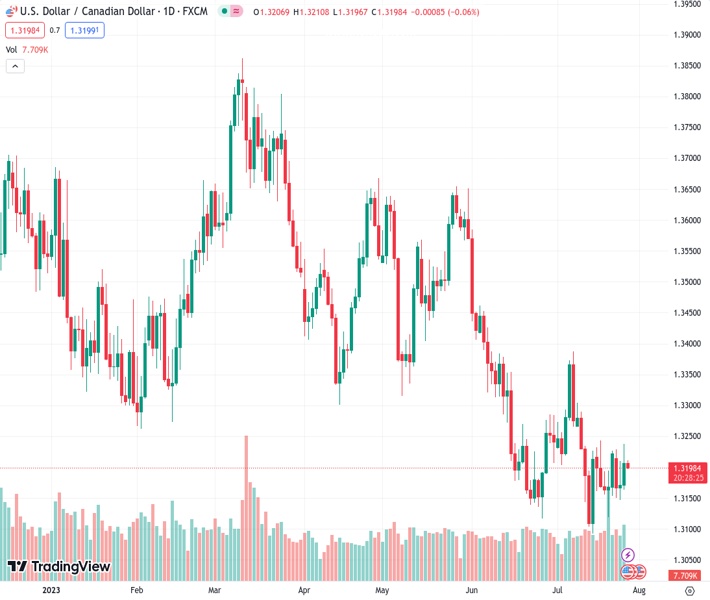
The pair currently trades last at 1.31998.
The previous day high was 1.3238 while the previous day low was 1.3169. The daily 38.2% Fib levels comes at 1.3211, expected to provide resistance. Similarly, the daily 61.8% fib level is at 1.3195, expected to provide support.
The USD/CAD pair struggles to gain and loses momentum above the 1.3200 mark during the early Asian session on Thursday. The major pair currently trades around 1.3204, down 0.03% for the day. The US Dollar is weakening following the Federal Open Market Committee (FOMC) meeting.
The Federal Open Market Committee (FOMC) hiked its interest rate by a quarter percentage point to a target range of 5.25%–5.5%, a move markets had fully priced in. This is the 11th rate hike since the FOMC began tightening policy in March 2022.
Following the rate decision, Fed Chairman Jerome Powell stated that the FOMC will assess the totality of incoming data, along with its implications for economic activity and inflation. He added that it’s possible to raise the fed funds rate again at the September meeting if the data warrants it.
The data released earlier this week revealed that the Conference Board’s Consumer Confidence Index rose to 117 in July from 110.1 (revised from 109) in June. On the same line, the House Price Index for May YoY came in at 2.8%, above expectations of 2.6% but below the prior month’s data. Investors will digest the data from the Fed meeting and take cues from the upcoming economic data later in the week.
On the Canadian Dollar front, the Bank of Canada (BoC) increased interest rates by 25 basis points (bps) to a 22-year high of 5.0% on July 12. The central bank has hiked rates ten times since March 2022. Despite this, market players anticipated that the BoC would likely not see the need to raise rates further this year.
According to a survey of market participants released by the central bank on Monday, a median of the participants anticipate the bank to maintain interest rates at a 22-year high of 5.00% until the end of 2023 before cutting the rates in March.
In the meantime, the Canadian Dollar might attract some follow-through buying amid upbeat oil prices. It’s worth noting that Canada is the leading oil exporter to the United States, and higher crude prices strengthen the Canadian Dollar.
Looking ahead, market participants will focus on the release of US Advanced Gross Domestic Product (GDP) QoQ, core Personal Consumption Expenditure (PCE) Price Index MoM, Durable Goods Orders, and Initial Jobless Claims data later in the day. Also, the Canadian Gross Domestic Product for May MoM will be due on Friday. These data could give the USD/CAD pair a clear direction.
Technical Levels: Supports and Resistances
USDCAD currently trading at 1.3205 at the time of writing. Pair opened at 1.3208 and is trading with a change of -0.02 % .
| Overview | Overview.1 | |
|---|---|---|
| 0 | Today last price | 1.3205 |
| 1 | Today Daily Change | -0.0003 |
| 2 | Today Daily Change % | -0.0200 |
| 3 | Today daily open | 1.3208 |
The pair remains strongly bearish on the daily time frame. It trades below the 20 SMA @ 1.322, 50 SMA 1.3316, 100 SMA @ 1.3435 and 200 SMA @ 1.3468.
| Trends | Trends.1 | |
|---|---|---|
| 0 | Daily SMA20 | 1.3220 |
| 1 | Daily SMA50 | 1.3316 |
| 2 | Daily SMA100 | 1.3435 |
| 3 | Daily SMA200 | 1.3468 |
The previous day high was 1.3238 while the previous day low was 1.3169. The daily 38.2% Fib levels comes at 1.3211, expected to provide resistance. Similarly, the daily 61.8% fib level is at 1.3195, expected to provide support.
Note the levels of interest below:
- Pivot support is noted at 1.3172, 1.3136, 1.3103
- Pivot resistance is noted at 1.3241, 1.3274, 1.331
| Levels | Levels.1 |
|---|---|
| Previous Daily High | 1.3238 |
| Previous Daily Low | 1.3169 |
| Previous Weekly High | 1.3244 |
| Previous Weekly Low | 1.3120 |
| Previous Monthly High | 1.3585 |
| Previous Monthly Low | 1.3117 |
| Daily Fibonacci 38.2% | 1.3211 |
| Daily Fibonacci 61.8% | 1.3195 |
| Daily Pivot Point S1 | 1.3172 |
| Daily Pivot Point S2 | 1.3136 |
| Daily Pivot Point S3 | 1.3103 |
| Daily Pivot Point R1 | 1.3241 |
| Daily Pivot Point R2 | 1.3274 |
| Daily Pivot Point R3 | 1.3310 |
[/s2If]
Download Nehcap EAWe have two EAs that are operational on our LIVE accounts.
- EA-FIX: Check out the details here. Download EA-FIX . EA-FIX is a non-grid HFT scalper.
- EA-GROWTH: High quality low dd EA using trend grids. Download EA_GROWTHJoin Our Telegram Group
")


