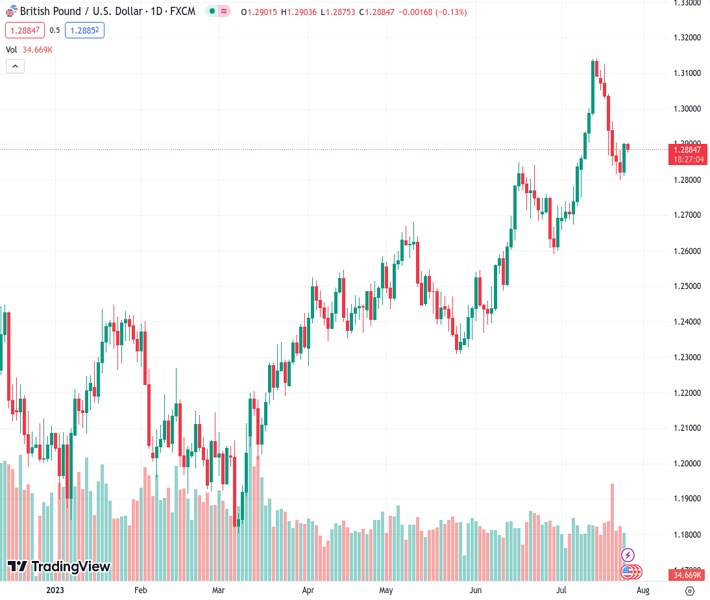
The GBP/USD pair encountered resistance on Wednesday at a price of 1.28853, causing it to give back some of the gains it had made overnight.
…
This is a premium post.
[s2If !current_user_can(access_s2member_level4)]Please register for FREE REGISTER to read full post below containing analysis. In case of any error or you think you are not able to read the full post below, please email us at support#nehcap.com [lwa][/s2If] [s2If current_user_can(access_s2member_level1)]
- GBP/USD meets with some supply on Wednesday and erodes a part of the overnight gains.
The pair currently trades last at 1.28853.
The previous day high was 1.2905 while the previous day low was 1.281. The daily 38.2% Fib levels comes at 1.2868, expected to provide support. Similarly, the daily 61.8% fib level is at 1.2846, expected to provide support.
The GBP/USD pair struggles to capitalize on the previous day’s goodish recovery move from the vicinity of over a two-week low and attracts some sellers near the 1.2900 mark during the Asian session on Wednesday. Spot prices currently trade around the 1.2880-1.2875 region, down nearly 0.20% for the day, though the downside seems cushioned as traders keenly await the outcome of the highly-anticipated two-day FOMC policy meeting.
The Federal Reserve (Fed) is scheduled to announce its decision later this Wednesday and is widely anticipated to hike interest rates by 25 bps. Investors, however, remain sceptic if the US central bank will commit to a more dovish stance or stick to its forecast for a 50 bps rate hike by the end of this year. This, along with Tuesday’s upbeat Conference Board’s Consumer Confidence Index, assists the US Dollar (USD) to hold steady just below a two-week high. Apart from this, reduced bets for more aggressive policy tightening by the Bank of England (BoE) continue to undermine the British Pound (GBP) and exert some pressure on the GBP/USD pair.
From a technical perspective, spot prices earlier this week managed to defend an ascending trend-line extending from May’s swing low and stalled the recent sharp corrective decline from the highest level since April 2022 touched earlier this month. The said support, currently pegged around the 1.2800 mark, should act as a pivotal point for short-term traders. A convincing break below might shift the bias in favour of bearish traders and drag the GBP/USD pair to the 1.2755-1.2750 intermediate support en route to the 1.2700 level.
The latter is closely followed by the 50-day Simple Moving Average (SMA), currently around the 1.2675 region. Some follow-through selling could expose the 1.2600 mark before spot prices eventually drop to test the next relevant support near the 1.2530-1.2525 region.
On the flip side, movement above the 1.2900 round figure is likely to confront stiff resistance near the 1.2930 area, representing 38.2% Fibo. level. That said, a sustained strength beyond will suggest that the recent downtrend witnessed over the past two weeks or so has run its course. The GBP/USD pair might then aim to reclaim the 1.3000 psychological mark, also representing the 23.6% Fibo. level. The subsequent move-up has the potential to lift spot prices beyond the 1.3040 area, towards the 1.3100 round-figure mark.
Technical Levels: Supports and Resistances
GBPUSD currently trading at 1.2885 at the time of writing. Pair opened at 1.2903 and is trading with a change of -0.14 % .
| Overview | Overview.1 | |
|---|---|---|
| 0 | Today last price | 1.2885 |
| 1 | Today Daily Change | -0.0018 |
| 2 | Today Daily Change % | -0.1400 |
| 3 | Today daily open | 1.2903 |
The pair remains strongly bullish on the daily timeframe. It trades above its 20 SMA @ 1.2857, 50 SMA 1.2673, 100 SMA @ 1.2526 and 200 SMA @ 1.2262.
| Trends | Trends.1 | |
|---|---|---|
| 0 | Daily SMA20 | 1.2857 |
| 1 | Daily SMA50 | 1.2673 |
| 2 | Daily SMA100 | 1.2526 |
| 3 | Daily SMA200 | 1.2262 |
The previous day high was 1.2905 while the previous day low was 1.281. The daily 38.2% Fib levels comes at 1.2868, expected to provide support. Similarly, the daily 61.8% fib level is at 1.2846, expected to provide support.
Note the levels of interest below:
- Pivot support is noted at 1.284, 1.2777, 1.2744
- Pivot resistance is noted at 1.2935, 1.2968, 1.3031
| Levels | Levels.1 |
|---|---|
| Previous Daily High | 1.2905 |
| Previous Daily Low | 1.2810 |
| Previous Weekly High | 1.3126 |
| Previous Weekly Low | 1.2816 |
| Previous Monthly High | 1.2848 |
| Previous Monthly Low | 1.2369 |
| Daily Fibonacci 38.2% | 1.2868 |
| Daily Fibonacci 61.8% | 1.2846 |
| Daily Pivot Point S1 | 1.2840 |
| Daily Pivot Point S2 | 1.2777 |
| Daily Pivot Point S3 | 1.2744 |
| Daily Pivot Point R1 | 1.2935 |
| Daily Pivot Point R2 | 1.2968 |
| Daily Pivot Point R3 | 1.3031 |
[/s2If]
Download Nehcap EAWe have two EAs that are operational on our LIVE accounts.
- EA-FIX: Check out the details here. Download EA-FIX . EA-FIX is a non-grid HFT scalper.
- EA-GROWTH: High quality low dd EA using trend grids. Download EA_GROWTHJoin Our Telegram Group
")


