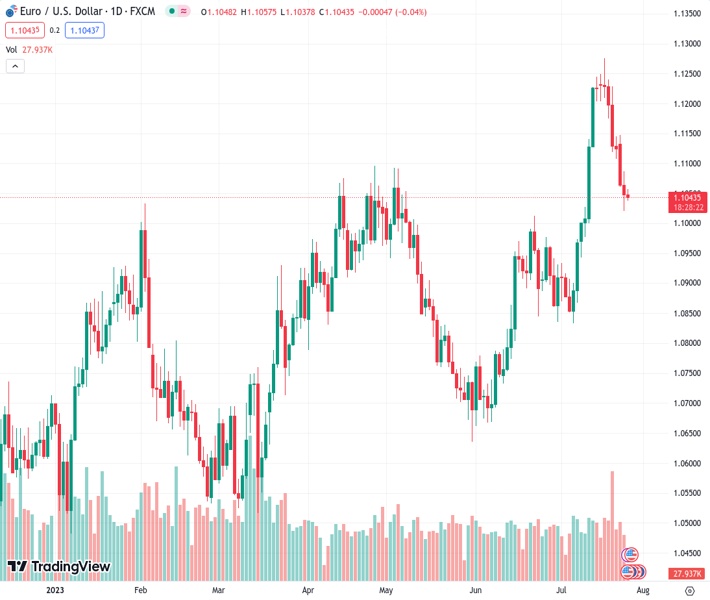
The EURUSD pair, trading at 1.10428, continues to decline and approaches the 1.1040 level on Wednesday.
…
This is a premium post.
[s2If !current_user_can(access_s2member_level4)]Please register for FREE REGISTER to read full post below containing analysis. In case of any error or you think you are not able to read the full post below, please email us at support#nehcap.com [lwa][/s2If] [s2If current_user_can(access_s2member_level1)]
- EUR/USD extends its downside near 1.1040 region on Wednesday.
The pair currently trades last at 1.10428.
The previous day high was 1.1087 while the previous day low was 1.1021. The daily 38.2% Fib levels comes at 1.1046, expected to provide resistance. Similarly, the daily 61.8% fib level is at 1.1062, expected to provide resistance.
The EUR/USD pair extends its downside and edges lower to the 1.1040 mark in the early Asian session. The major pair trades on a negative note for six consecutive days on Wednesday as concerns about an economic slowdown in the Eurozone emerged.
The Euro remains under pressure following the downbeat economic data released. On Tuesday, the IFO Institute’s monthly survey reported that July’s German Business Climate Index decreased from 88.6 to 87.3. This result fell short of the market’s estimate of 88.0. Klaus Wohlrabe, head of IFO surveys, told Reuters that the German Gross Domestic Product (GDP) was likely to contract in the third quarter, which exerts pressure on the Euro.
Earlier this week, the Eurozone manufacturing sector’s woes worsened in July, with the Manufacturing PMI decreasing to 42.7, below market expectations of 43.5 and June’s reading of 43.4. The index reached its lowest level in 38 months.
The ECB is anticipated to raise rates by 25 basis points (bps) on Thursday. Still, the possibility of a rate hike in September has decreased as the EU economy has slowed and the fear of recession has arisen.
Across the pond, the Conference Board’s Consumer Confidence Index rose to 117 in July from 110.1 (revised from 109) in June. On the same line, the House Price Index for May YoY came in at 2.8%, above expectations of 2.6% but below the prior month’s data. The Richmond Fed Manufacturing Index declined from -8 in June to -9 in July.
The Federal Reserve (Fed) will announce its monetary policy decision on Wednesday. The Fed is widely anticipated to raise interest rates by 25 basis points (bps) to 5.25–5.50%. Market participants will watch Fed Chairman Jerome Powell’s press conference for hints about the forward path of monetary policy. This key event could trigger volatility across financial markets.
Looking ahead, market participants are simultaneously preparing for the release of the US Federal Reserve (Fed) and the European Central Bank (ECB) monetary policy decisions on Wednesday and Thursday, respectively. Also, the FOMC Press Conference and the ECB Press Conference will be closely watched. Apart from this, the US Advanced Gross Domestic Product (GDP) QoQ and the core Personal Consumption Expenditure (PCE) Price Index MoM will be due later this week.
Technical Levels: Supports and Resistances
EURUSD currently trading at 1.1039 at the time of writing. Pair opened at 1.1052 and is trading with a change of -0.12 % .
| Overview | Overview.1 | |
|---|---|---|
| 0 | Today last price | 1.1039 |
| 1 | Today Daily Change | -0.0013 |
| 2 | Today Daily Change % | -0.1200 |
| 3 | Today daily open | 1.1052 |
The pair is trading below its 20 Daily moving average @ 1.1041, above its 50 Daily moving average @ 1.0901 , above its 100 Daily moving average @ 1.0891 and above its 200 Daily moving average @ 1.0701
| Trends | Trends.1 | |
|---|---|---|
| 0 | Daily SMA20 | 1.1041 |
| 1 | Daily SMA50 | 1.0901 |
| 2 | Daily SMA100 | 1.0891 |
| 3 | Daily SMA200 | 1.0701 |
The previous day high was 1.1087 while the previous day low was 1.1021. The daily 38.2% Fib levels comes at 1.1046, expected to provide resistance. Similarly, the daily 61.8% fib level is at 1.1062, expected to provide resistance.
Note the levels of interest below:
- Pivot support is noted at 1.102, 1.0987, 1.0954
- Pivot resistance is noted at 1.1086, 1.1119, 1.1152
| Levels | Levels.1 |
|---|---|
| Previous Daily High | 1.1087 |
| Previous Daily Low | 1.1021 |
| Previous Weekly High | 1.1276 |
| Previous Weekly Low | 1.1108 |
| Previous Monthly High | 1.1012 |
| Previous Monthly Low | 1.0662 |
| Daily Fibonacci 38.2% | 1.1046 |
| Daily Fibonacci 61.8% | 1.1062 |
| Daily Pivot Point S1 | 1.1020 |
| Daily Pivot Point S2 | 1.0987 |
| Daily Pivot Point S3 | 1.0954 |
| Daily Pivot Point R1 | 1.1086 |
| Daily Pivot Point R2 | 1.1119 |
| Daily Pivot Point R3 | 1.1152 |
[/s2If]
Download Nehcap EAWe have two EAs that are operational on our LIVE accounts.
- EA-FIX: Check out the details here. Download EA-FIX . EA-FIX is a non-grid HFT scalper.
- EA-GROWTH: High quality low dd EA using trend grids. Download EA_GROWTHJoin Our Telegram Group
")


