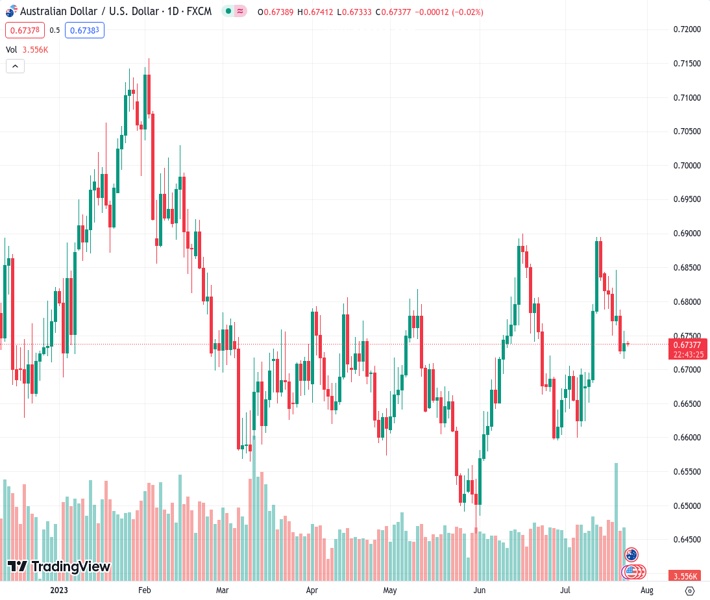
The AUDUSD currency pair is experiencing an upward movement after rebounding from its lowest points in almost a fortnight.
…
This is a premium post.
[s2If !current_user_can(access_s2member_level4)]Please register for FREE REGISTER to read full post below containing analysis. In case of any error or you think you are not able to read the full post below, please email us at support#nehcap.com [lwa][/s2If] [s2If current_user_can(access_s2member_level1)]
- AUD/USD grinds higher after bouncing off the lowest levels in nearly two weeks.
The pair currently trades last at 0.67381.
The previous day high was 0.6788 while the previous day low was 0.6722. The daily 38.2% Fib levels comes at 0.6747, expected to provide resistance. Similarly, the daily 61.8% fib level is at 0.6763, expected to provide resistance.
AUD/USD holds onto the week-start rebound from the lowest levels since July 12 to around 0.6740 amid the early hours of Tuesday’s Asian session. In doing so, the Aussie pair justifies its risk-barometer status, as well as cheers headlines suggesting more stimulus from China, while ignoring the firmer US Dollar and mixed data at home.
On Monday, Australia’s preliminary S&P Global Manufacturing PMI for July improved to 49.6 from 48.2 prior but the Services PMI drops below the 50.0 level to 48.0 versus 50.3 prior, suggesting a contraction in the activities. With this, the S&P Global Composite PMI for July eases to 48.3 from 50.1.
On the other hand, the first readings of the US S&P Global Manufacturing PMI for July improved to 49.0 from 46.3 prior and 46.4 market forecasts while the Services PMI eased to 52.4 versus 54.0 expected and 54.4 previous readings. With this, the Composite PMI edged lower to 52.0 from 53.2 prior and 53.1 market forecasts. That said, Chicago Fed National Activity Index for June slid to -0.32 from -0.28 prior (revised) and 0.03 market forecasts.
Despite the mostly unimpressive data, the bird’s eye view of the global PMI suggests a sooner end of the restrictive monetary policies at the major central bank, including the Federal Reserve (Fed), which in turn allowed the market players to remain optimistic on Monday and fuelled the AUD/USD pair.
Further, the Chinese media conveyed details of the Communist Party’s Politburo meeting on Monday that cited new difficulties and challenges for the economy while also showing the policymakers’ readiness for prudent monetary and fiscal policies. Before that, China state planner National Development and Reform Commission (NDRC) issued a notice to promote the high-quality development of private investment. That said, NDRC also pledged encouragement of participation in some projects of transport, water and clean energy, as well as in new infrastructure and modern agriculture.
Apart from China stimulus headlines, hopes of witnessing an upbeat budget surplus also favored the AUD/USD bulls. Australia Treasurer Jim Chalmers said the previous day that he expects that the country’s budget surplus will be set at around AUD20 billion, defending June’s forecast versus May’s AUD4.2 billion (USD2.81 billion) projections.
Amid these plays, Wall Street closed with gains and the US Treasury bond yields joined the US Dollar Index (DXY) to remain firmer.
Moving on, a light calendar at home may allow the AUD/USD to defend the latest gains but challenges to sentiment and cautious mood ahead of Wednesday’s Australian inflation, as well as the Federal Reserve’s monetary policy meeting, may test the pair buyers. That said, US CB Consumer Confidence for July will entertain the traders in the US session.
Although the 200-DMA restricts the immediate downside of the AUD/USD pair to around 0.6720, a daily closing beyond a one-week-old descending trend line resistance, around 0.6750 at the latest, becomes necessary for the bulls to retake control.
Technical Levels: Supports and Resistances
AUDUSD currently trading at 0.674 at the time of writing. Pair opened at 0.6731 and is trading with a change of 0.13% % .
| Overview | Overview.1 | |
|---|---|---|
| 0 | Today last price | 0.674 |
| 1 | Today Daily Change | 0.0009 |
| 2 | Today Daily Change % | 0.13% |
| 3 | Today daily open | 0.6731 |
The pair remains strongly bullish on the daily timeframe. It trades above its 20 SMA @ 0.6718, 50 SMA 0.6691, 100 SMA @ 0.6687 and 200 SMA @ 0.6718.
| Trends | Trends.1 | |
|---|---|---|
| 0 | Daily SMA20 | 0.6718 |
| 1 | Daily SMA50 | 0.6691 |
| 2 | Daily SMA100 | 0.6687 |
| 3 | Daily SMA200 | 0.6718 |
The previous day high was 0.6788 while the previous day low was 0.6722. The daily 38.2% Fib levels comes at 0.6747, expected to provide resistance. Similarly, the daily 61.8% fib level is at 0.6763, expected to provide resistance.
Note the levels of interest below:
- Pivot support is noted at 0.6706, 0.6682, 0.6641
- Pivot resistance is noted at 0.6772, 0.6813, 0.6838
| Levels | Levels.1 |
|---|---|
| Previous Daily High | 0.6788 |
| Previous Daily Low | 0.6722 |
| Previous Weekly High | 0.6854 |
| Previous Weekly Low | 0.6722 |
| Previous Monthly High | 0.6900 |
| Previous Monthly Low | 0.6484 |
| Daily Fibonacci 38.2% | 0.6747 |
| Daily Fibonacci 61.8% | 0.6763 |
| Daily Pivot Point S1 | 0.6706 |
| Daily Pivot Point S2 | 0.6682 |
| Daily Pivot Point S3 | 0.6641 |
| Daily Pivot Point R1 | 0.6772 |
| Daily Pivot Point R2 | 0.6813 |
| Daily Pivot Point R3 | 0.6838 |
[/s2If]
Download Nehcap EAWe have two EAs that are operational on our LIVE accounts.
- EA-FIX: Check out the details here. Download EA-FIX . EA-FIX is a non-grid HFT scalper.
- EA-GROWTH: High quality low dd EA using trend grids. Download EA_GROWTHJoin Our Telegram Group
")


