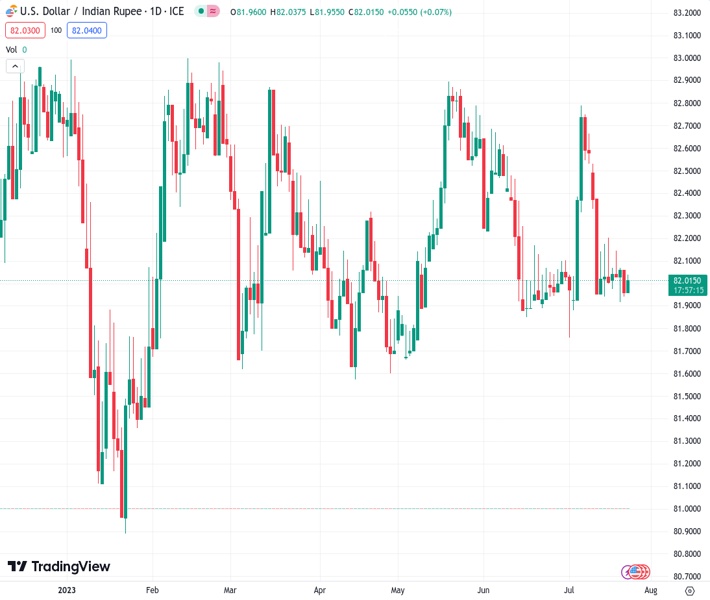
USDINR has remained unchanged at 82.0350 after a two-week decline but has recently experienced a slight increase.
…
This is a premium post.
[s2If !current_user_can(access_s2member_level4)]Please register for FREE REGISTER to read full post below containing analysis. In case of any error or you think you are not able to read the full post below, please email us at support#nehcap.com [lwa][/s2If] [s2If current_user_can(access_s2member_level1)]
- USD/INR remains sidelined after two-week downtrend, edges higher of late.
The pair currently trades last at 82.0350.
The previous day high was 82.1602 while the previous day low was 81.914. The daily 38.2% Fib levels comes at 82.0081, expected to provide support. Similarly, the daily 61.8% fib level is at 82.0662, expected to provide resistance.
USD/INR grinds higher past 82.00, mostly defensive around 82.05 amid early Monday, as it consolidates the previous two-week downtrend during the market’s cautious mood ahead of the top-tier US data/events. In doing so, the Indian Rupee (INR) pair also struggles to justify the mostly upbeat Reuters poll about the Asian economy.
That said, Reuters’ latest poll of 53 economists, conducted between July 01 and 21, suggests that the nation could grow at an annual pace of 6.1% during the current fiscal year, as well as register the 6.5% growth rate in the next year. The survey, however, also mentioned that the employment situation will only improve slightly. It’s worth noting that the survey’s outlook for the Indian economy remains the same while suggesting a leapfrog toward gaining the status of a developed nation.
It should be noted that the US Dollar’s retreat prods the USD/INR buyers while the upbeat prints of the Oil price put a floor under the Indian Rupee (INR) pair due to the nation’s heavy reliance on energy imports.
With this, the US Dollar Index (DXY) licks its wounds around the intraday low near 101.00. On the other hand, WTI crude oil remains indecisive near $76.75, making rounds to the highest levels in three months as energy traders struggle to digest mixed comments from International Energy Agency (IEA) Executive Director Fatih Barol and United Arab Emirates (UAE) Energy Minister Suhail al-Mazrouei at the Group of 20 (G20) energy ministers’ meeting held in India.
During the last week, the US housing numbers and regional manufacturing indices were mostly downbeat but an improvement in the Retail Sales Control Group for June allowed the DXY to rebound from a 15-month low, as well as post the first weekly gain in three. Previously, the upbeat prints of the University of Michigan’s (UoM) Consumer Sentiment Index and consumer inflation expectations for July helped the greenback to challenge the bearish bias. It’s worth noting, however, that the US Consumer Price Index (CPI) and Producer Price Index (PPI) for June joined the first below-expectations Nonfarm Payrolls (NFP) in 15 months to tease the Federal Reserve’s (Fed) policy pivot past July and drowned the US Dollar.
Hence, the US Dollar’s previous week’s rebound from the 15-month low appears elusive and hence speech from Fed Chair Jerome Powell will be crucial to watch. Additionally important will be the first readings of the US second-quarter (Q2) 2023 Gross Domestic Product (GDP) and July PMIs.
Despite the latest corrective bounce, a clear reversal from the 200-DMA hurdle, as well as a downside break of the previous support line stretched from mid-April, respectively around 82.20 and 82.10, keeps the USD/INR bears hopeful of revisiting the monthly low of around 81.75.
Technical Levels: Supports and Resistances
USDINR currently trading at 82.0357 at the time of writing. Pair opened at 82.003 and is trading with a change of 0.04% % .
| Overview | Overview.1 | |
|---|---|---|
| 0 | Today last price | 82.0357 |
| 1 | Today Daily Change | 0.0327 |
| 2 | Today Daily Change % | 0.04% |
| 3 | Today daily open | 82.003 |
The pair remains strongly bearish on the daily time frame. It trades below the 20 SMA @ 82.1785, 50 SMA 82.3091, 100 SMA @ 82.1931 and 200 SMA @ 82.1736.
| Trends | Trends.1 | |
|---|---|---|
| 0 | Daily SMA20 | 82.1785 |
| 1 | Daily SMA50 | 82.3091 |
| 2 | Daily SMA100 | 82.1931 |
| 3 | Daily SMA200 | 82.1736 |
The previous day high was 82.1602 while the previous day low was 81.914. The daily 38.2% Fib levels comes at 82.0081, expected to provide support. Similarly, the daily 61.8% fib level is at 82.0662, expected to provide resistance.
Note the levels of interest below:
- Pivot support is noted at 81.8913, 81.7796, 81.6451
- Pivot resistance is noted at 82.1375, 82.272, 82.3837
| Levels | Levels.1 |
|---|---|
| Previous Daily High | 82.1602 |
| Previous Daily Low | 81.9140 |
| Previous Weekly High | 82.2014 |
| Previous Weekly Low | 81.9116 |
| Previous Monthly High | 82.7370 |
| Previous Monthly Low | 81.8477 |
| Daily Fibonacci 38.2% | 82.0081 |
| Daily Fibonacci 61.8% | 82.0662 |
| Daily Pivot Point S1 | 81.8913 |
| Daily Pivot Point S2 | 81.7796 |
| Daily Pivot Point S3 | 81.6451 |
| Daily Pivot Point R1 | 82.1375 |
| Daily Pivot Point R2 | 82.2720 |
| Daily Pivot Point R3 | 82.3837 |
[/s2If]
Download Nehcap EAWe have two EAs that are operational on our LIVE accounts.
- EA-FIX: Check out the details here. Download EA-FIX . EA-FIX is a non-grid HFT scalper.
- EA-GROWTH: High quality low dd EA using trend grids. Download EA_GROWTHJoin Our Telegram Group
")


