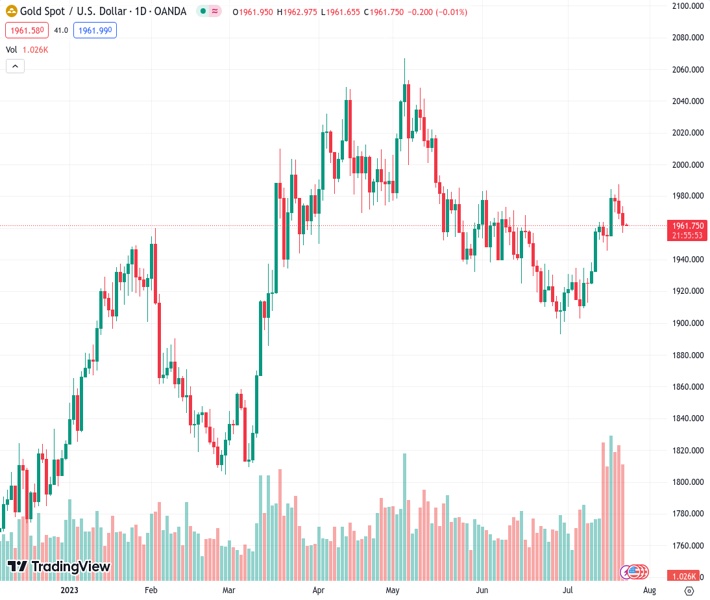
The price of gold, indicated by #XAUUSD at 1,962.57, continues to face downwards pressure as it approaches the important combination of simple moving averages (SMA) after three consecutive days of losses from its recent peak that lasted several weeks. According to the view of @nehcap, it is anticipated that the price will not decline significantly.
…
This is a premium post.
[s2If !current_user_can(access_s2member_level4)]Please register for FREE REGISTER to read full post below containing analysis. In case of any error or you think you are not able to read the full post below, please email us at support#nehcap.com [lwa][/s2If] [s2If current_user_can(access_s2member_level1)]
- Gold Price remains pressured towards the key SMA confluence after three-day losing streak from multi-week high.
The pair currently trades last at 1962.57.
The previous day high was 1973.84 while the previous day low was 1956.88. The daily 38.2% Fib levels comes at 1963.36, expected to provide resistance. Similarly, the daily 61.8% fib level is at 1967.36, expected to provide resistance.
Gold Price (XAU/USD) remains defensive around $1,960 as bulls and bears jostle amid the early hours of the key week comprising a slew of top-tier data/events, stabilizing after a three-day downtrend. That said, the XAU/USD dropped in the last three consecutive days on the US Dollar’s notable run-up. However, the market’s risk-on mood and cautious sentiment ahead of this week’s A-list events put a floor under the Gold Price.
Gold Price dropped in the last three consecutive days, reversing from a multi-week high, amid the US Dollar’s corrective bounce off the lowest levels since early 2022. However, the greenback bulls are less convinced ahead of the top-tier United States data and the Federal Reserve (Fed) monetary policy, which in turn allows the XAU/USD bears to take a breather.
During the last week, United States housing numbers and regional manufacturing indices were mostly downbeat but an improvement in the Retail Sales Control Group for June allowed the US Dollar Index (DXY) to rebound from a 15-month low, as well as post the first weekly gain in three. That said, the greenback’s gauge versus six major currencies seesaw around 101.00 amid a sluggish start to the key week.
Before that, the upbeat prints of the University of Michigan’s (UoM) Consumer Sentiment Index and consumer inflation expectations for July helped the greenback to challenge the bearish bias.
It’s worth noting, however, that the US Consumer Price Index (CPI) and Producer Price Index (PPI) for June joined the first below-expectations Nonfarm Payrolls (NFP) in 15 months to tease the Federal Reserve’s (Fed) policy pivot past July and drowned the US Dollar, which in turn propelled the Gold Price earlier in July.
Hence, the latest recovery in the US Dollar appears to lack support from the top-tier US inflation and employment data, which in turn prods the Gold sellers as the key week begins.
Despite the US Dollar’s run-up and the last three-day downtrend, the Gold Price ended up posting weekly gains as the market’s anxiety ahead of this week’s data/events pushed traders toward the traditional safe-haven. Also putting a floor under the XAU/USD could be the mixed headlines about the US-China ties and the recent optimism in India, as well as in the US.
It should be noted that Washington appears in the mood to restore its political ties with Beijing via multiple diplomatic visits and hence suggest likely better days for the Sino-US trade, as well as the Gold price, moving forward.
Elsewhere, markets in India and the US have recently refreshed their yearly highs even as the Treasury bond yields also improved, which in turn suggests more XAU/USD demand from the key customers and battled the Gold bears.
Given the lack of confidence in the US Dollar’s recovery, the XAU/USD buyers remain hopeful by keeping their eyes on the first readings of the top-tier United States data, as well as the monetary policy announcements from the Fed.
That said, the first readings of the US second-quarter (Q2) 2023 Gross Domestic Product (GDP) Annualized, expected 1.6% versus 2.0% prior, will be the key data to watch for the Gold traders. On the same line are the initial readings of the US Q2 Personal Consumption Expenditures (PCE) Prices and Purchasing Managers Indexes (PMIs) for July. Additionally, the Fed’s preferred inflation gauge, namely the PCE Price Index and Consumer Confidence for June and July respectively will also entertain the Gold Price traders moving forward.
Apart from the aforementioned top-tier catalysts, today’s preliminary readings of July’s Purchasing Managers’ Indexes (PMIs) for the Eurozone and the US will be crucial to watch for the Gold traders. Should the scheduled data arrive positive for the US, led by stronger prints of services PMI, the Gold Price may witness further downside.
Above all, the Federal Reserve’s (Fed) ability to defend the hawks, even after announcing the widely anticipated 0.25% rate hike, will be crucial to watch for the XAU/USD traders.
Gold Price reversed from a nine-week-old horizontal resistance and broke a fortnight-long support line to convince sellers.
The downside bias about the XAU/USD also takes clues from the bearish signals from the Moving Average Convergence and Divergence (MACD) indicator and the descending Relative Strength Index (RSI), placed at 14, which is not oversold.
With this, the Gold Price appears set to test the convergence of the 100 and 200 Simple Moving Average (SMA), close to $1,940 by the press time.
However, the XAU/USD’s downside past $1,940 seems difficult as multiple levels marked from late May, around $1,935-30, can challenge the bears afterward.
In a case where the Gold Price remains bearish past $1,930, the odds of witnessing a slump toward the $1,900 round figure and then to the yearly low of $1,893 marked in June can’t be ruled out.
Alternatively, the support-turned-resistance line stretched from early July, around $1,975 by the press time, guards the immediate upside of the XAU/USD price.
Following that, the previously stated multi-week-old horizontal resistance area surrounding $1,985 will be in the spotlight.
Should the Gold Price remains bullish past $1,985, the $2,000 round figure will act as the final defense of the bears.
Overall, the Gold price is likely to witness further downside but the road towards the south is long and bumpy.
Trend: Limited downside expected
Technical Levels: Supports and Resistances
XAUUSD currently trading at 1961.84 at the time of writing. Pair opened at 1961.84 and is trading with a change of 0.00% % .
| Overview | Overview.1 | |
|---|---|---|
| 0 | Today last price | 1961.84 |
| 1 | Today Daily Change | 0.00 |
| 2 | Today Daily Change % | 0.00% |
| 3 | Today daily open | 1961.84 |
The pair remains strongly bullish on the daily timeframe. It trades above its 20 SMA @ 1937.15, 50 SMA 1949.11, 100 SMA @ 1960.77 and 200 SMA @ 1879.77.
| Trends | Trends.1 | |
|---|---|---|
| 0 | Daily SMA20 | 1937.15 |
| 1 | Daily SMA50 | 1949.11 |
| 2 | Daily SMA100 | 1960.77 |
| 3 | Daily SMA200 | 1879.77 |
The previous day high was 1973.84 while the previous day low was 1956.88. The daily 38.2% Fib levels comes at 1963.36, expected to provide resistance. Similarly, the daily 61.8% fib level is at 1967.36, expected to provide resistance.
Note the levels of interest below:
- Pivot support is noted at 1954.53, 1947.23, 1937.57
- Pivot resistance is noted at 1971.49, 1981.15, 1988.45
| Levels | Levels.1 |
|---|---|
| Previous Daily High | 1973.84 |
| Previous Daily Low | 1956.88 |
| Previous Weekly High | 1987.54 |
| Previous Weekly Low | 1945.85 |
| Previous Monthly High | 1983.50 |
| Previous Monthly Low | 1893.01 |
| Daily Fibonacci 38.2% | 1963.36 |
| Daily Fibonacci 61.8% | 1967.36 |
| Daily Pivot Point S1 | 1954.53 |
| Daily Pivot Point S2 | 1947.23 |
| Daily Pivot Point S3 | 1937.57 |
| Daily Pivot Point R1 | 1971.49 |
| Daily Pivot Point R2 | 1981.15 |
| Daily Pivot Point R3 | 1988.45 |
[/s2If]
Download Nehcap EAWe have two EAs that are operational on our LIVE accounts.
- EA-FIX: Check out the details here. Download EA-FIX . EA-FIX is a non-grid HFT scalper.
- EA-GROWTH: High quality low dd EA using trend grids. Download EA_GROWTHJoin Our Telegram Group
")


