Wall Street is experiencing a partial rebound from the losses it faced on Thursday as a result of underwhelming tech company earnings. Attention is now focused on the upcoming Federal Open Market Committee (FOMC) meeting, as the absence of US economic data contributes to the market’s anticipation.
…
This is a premium post.
[s2If !current_user_can(access_s2member_level4)]Please register for FREE REGISTER to read full post below containing analysis. In case of any error or you think you are not able to read the full post below, please email us at support#nehcap.com [lwa][/s2If] [s2If current_user_can(access_s2member_level1)]
- Wall Street sees partial recovery from Thursday’s losses due to disappointing tech company earnings, while a lack of US economic data keeps focus on the upcoming Federal Open Market Committee (FOMC) meeting.
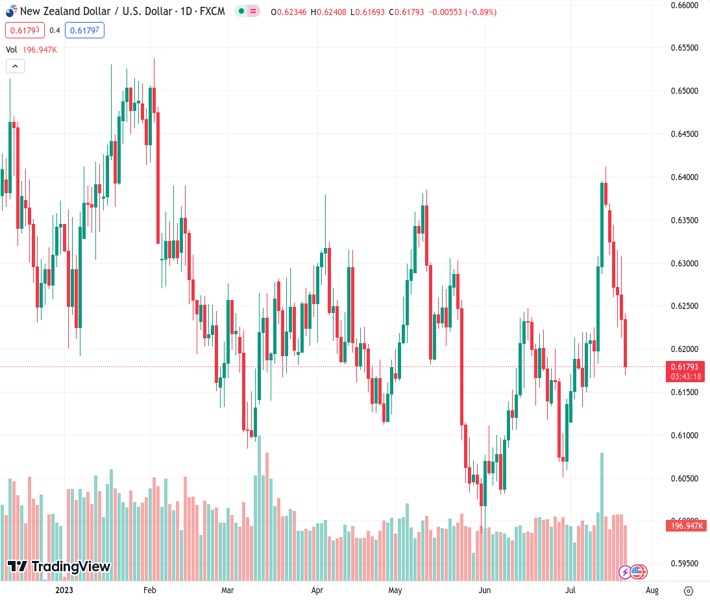
The pair currently trades last at 0.61801.
The previous day high was 0.6309 while the previous day low was 0.6213. The daily 38.2% Fib levels comes at 0.625, expected to provide resistance. Similarly, the daily 61.8% fib level is at 0.6272, expected to provide resistance.
NZD/USD dives below the 0.6200 figure, extending its losses past the 200-day Exponential Moving Average (EMA) of 0.6226, with the pair extending its losses to six straight days on overall US Dollar strength. At the time of writing, the NZD/USD is exchanging hands at 0.6175 after dropping from a daily high of 0.6240.
Wall Street pares some of Thursday’s losses on disappointing earnings from megacap tech companies. The lack of economic data in the United States (US) keeps NZD/USD traders bracing for the next week’s Federal Open Market Committee (FOMC) monetary policy decision, with the Federal Reserve (Fed) expected to deliver a 25 bps increase to the Federal Funds Rate (FFR), toward the 5.25%-5.50% area.
That follows a week that witnessed solid US economic data, as unemployment claims fell below estimates portraying a strong labor market and sparking fears for further Fed tightening, even though US retail sales printed mixed results. Turning to house market data, Housing Starts, Building Permits, and Existing Home Sales witnessed a dip after printing solid figures in May.
According to data from the CME FedWatch Tool, market players have fully priced in the next week’s increase but revised their bets upward from last week’s 19.8% to 28.0%.
Elsewhere, the latest Reserve Bank of New Zealand (RBNZ) monetary policy keeping rates unchanged is weighing on the New Zealand Dollar (NZD), which extended its weekly losses for almost 3%. That, despite fears of a slower recovery in China, despite the People Bank of China’s (PboC) efforts to prod its economy and achieve its annual target, would keep the NZD pressured.
Given the backdrop, the NZD/USD is warranted to extend its losses, but it would depend on the Fed and its Chair Jerome Powell to sustain a hawkish posture to keep the downtrend in the near term. Otherwise, the NZD/USD could recover after the FOMC’s decision.
The NZD/USD shifted to a neutral bias once the major broke technical support level, like the 200, 20, 100, and 50-day EMAs on its way south, but its fall remains cushioned by the June 29 daily low of 0.6050. Once cleared, the NZD/USD could test the year-to-date (YTD) low of 0.5985. To keep their hopes of higher prices, buyers must reclaim the 0.6200 mark, but they need to clear the confluence of the 50 and 100-day EMAs at 0.6201/02 before testing the 20-day EMA at 0.6227.
With the Relative Strength Index (RSI) turning bearish and the three-day Rate of Change (RoC) suggesting sellers gather momentum, the NZD/USD might continue to trend lower.
Technical Levels: Supports and Resistances
NZDUSD currently trading at 0.6175 at the time of writing. Pair opened at 0.6235 and is trading with a change of -0.96 % .
| Overview | Overview.1 | |
|---|---|---|
| 0 | Today last price | 0.6175 |
| 1 | Today Daily Change | -0.0060 |
| 2 | Today Daily Change % | -0.9600 |
| 3 | Today daily open | 0.6235 |
The pair is trading below its 20 Daily moving average @ 0.6207, above its 50 Daily moving average @ 0.6171 , below its 100 Daily moving average @ 0.6195 and below its 200 Daily moving average @ 0.6203
| Trends | Trends.1 | |
|---|---|---|
| 0 | Daily SMA20 | 0.6207 |
| 1 | Daily SMA50 | 0.6171 |
| 2 | Daily SMA100 | 0.6195 |
| 3 | Daily SMA200 | 0.6203 |
The previous day high was 0.6309 while the previous day low was 0.6213. The daily 38.2% Fib levels comes at 0.625, expected to provide resistance. Similarly, the daily 61.8% fib level is at 0.6272, expected to provide resistance.
Note the levels of interest below:
- Pivot support is noted at 0.6196, 0.6156, 0.61
- Pivot resistance is noted at 0.6292, 0.6348, 0.6388
| Levels | Levels.1 |
|---|---|
| Previous Daily High | 0.6309 |
| Previous Daily Low | 0.6213 |
| Previous Weekly High | 0.6413 |
| Previous Weekly Low | 0.6166 |
| Previous Monthly High | 0.6250 |
| Previous Monthly Low | 0.5990 |
| Daily Fibonacci 38.2% | 0.6250 |
| Daily Fibonacci 61.8% | 0.6272 |
| Daily Pivot Point S1 | 0.6196 |
| Daily Pivot Point S2 | 0.6156 |
| Daily Pivot Point S3 | 0.6100 |
| Daily Pivot Point R1 | 0.6292 |
| Daily Pivot Point R2 | 0.6348 |
| Daily Pivot Point R3 | 0.6388 |
[/s2If]
Download Nehcap EAWe have two EAs that are operational on our LIVE accounts.
- EA-FIX: Check out the details here. Download EA-FIX . EA-FIX is a non-grid HFT scalper.
- EA-GROWTH: High quality low dd EA using trend grids. Download EA_GROWTHJoin Our Telegram Group
")


