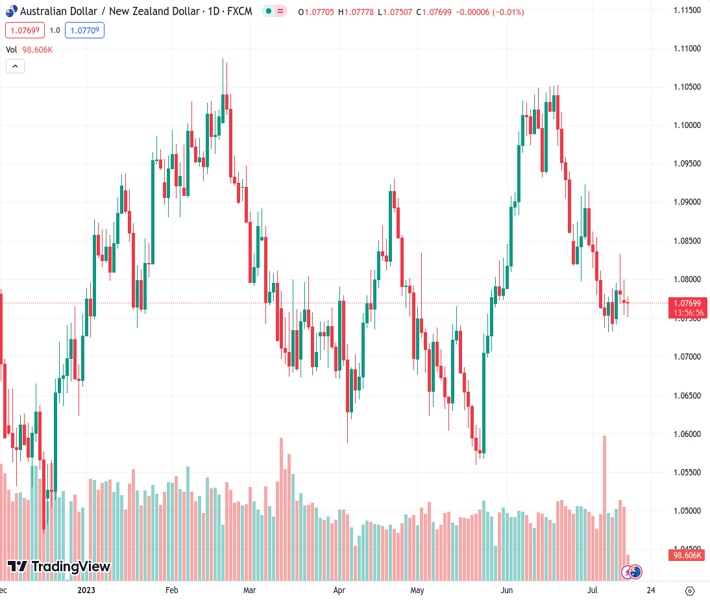
The AUDNZD currency pair, currently at a rate of 1.07690, is facing difficulties in finding a clear short-term trend and remains confined within a limited price range.
…
This is a premium post.
[s2If !current_user_can(access_s2member_level4)]Please register for FREE REGISTER to read full post below containing analysis. In case of any error or you think you are not able to read the full post below, please email us at support#nehcap.com [lwa][/s2If] [s2If current_user_can(access_s2member_level1)]
- AUD/NZD struggles for a firm intraday direction, stuck in a narrow range.
The pair currently trades last at 1.07690.
The previous day high was 1.08 while the previous day low was 1.0754. The daily 38.2% Fib levels comes at 1.0793, expected to provide resistance. Similarly, the daily 61.8% fib level is at 1.0808, expected to provide resistance.
The AUD/NZD pair consolidates in a narrow range between the 1.0750-1.0790 area on the four-hour chart. The path of least resistance for the AUD/NZD is to the downside, as the cross stands below the 200-hour Exponential Moving Average (EMA).
1.0800 acts as a critical barrier for the AUD/NZD bulls, representing a confluence of the upper boundary of the Bollinger Band, a psychological figure and a high of July 12. A break above the latter, AUD/NZD could still have legs to test 1.0835, the 200-hour EMA, followed by minor resistance at 1.0860 (High of July 3). The additional upside filter to watch is at 1.0920 (High of June 29).
On the downside, the cross will meet an initial support level at 1.0750, the lower limit of the Bollinger Bands. The next contention is seen at 1.0730 (Low of July 10), followed by 1.0690 (Low of April 28).
It’s worth noting that the Relative Strength Index (RSI) hovers between 40-60, indicating the non-directional movement for the AUD/NZD pair.
Technical Levels: Supports and Resistances
AUDNZD currently trading at 1.0767 at the time of writing. Pair opened at 1.0776 and is trading with a change of -0.08 % .
| Overview | Overview.1 | |
|---|---|---|
| 0 | Today last price | 1.0767 |
| 1 | Today Daily Change | -0.0009 |
| 2 | Today Daily Change % | -0.0800 |
| 3 | Today daily open | 1.0776 |
The pair remains strongly bearish on the daily time frame. It trades below the 20 SMA @ 1.0874, 50 SMA 1.0819, 100 SMA @ 1.0795 and 200 SMA @ 1.0839.
| Trends | Trends.1 | |
|---|---|---|
| 0 | Daily SMA20 | 1.0874 |
| 1 | Daily SMA50 | 1.0819 |
| 2 | Daily SMA100 | 1.0795 |
| 3 | Daily SMA200 | 1.0839 |
The previous day high was 1.08 while the previous day low was 1.0754. The daily 38.2% Fib levels comes at 1.0793, expected to provide resistance. Similarly, the daily 61.8% fib level is at 1.0808, expected to provide resistance.
Note the levels of interest below:
- Pivot support is noted at 1.0754, 1.073, 1.069
- Pivot resistance is noted at 1.0817, 1.0857, 1.0881
| Levels | Levels.1 |
|---|---|
| Previous Daily High | 1.0800 |
| Previous Daily Low | 1.0754 |
| Previous Weekly High | 1.0882 |
| Previous Weekly Low | 1.0736 |
| Previous Monthly High | 1.1062 |
| Previous Monthly Low | 1.0796 |
| Daily Fibonacci 38.2% | 1.0793 |
| Daily Fibonacci 61.8% | 1.0808 |
| Daily Pivot Point S1 | 1.0754 |
| Daily Pivot Point S2 | 1.0730 |
| Daily Pivot Point S3 | 1.0690 |
| Daily Pivot Point R1 | 1.0817 |
| Daily Pivot Point R2 | 1.0857 |
| Daily Pivot Point R3 | 1.0881 |
[/s2If]
Download Nehcap EAWe have two EAs that are operational on our LIVE accounts.
- EA-FIX: Check out the details here. Download EA-FIX . EA-FIX is a non-grid HFT scalper.
- EA-GROWTH: High quality low dd EA using trend grids. Download EA_GROWTHJoin Our Telegram Group
")


