The gold price is fluctuating around $1,960.00 as investors are waiting for additional catalysts.
…
This is a premium post.
[s2If !current_user_can(access_s2member_level4)]Please register for FREE REGISTER to read full post below containing analysis. In case of any error or you think you are not able to read the full post below, please email us at support#nehcap.com [lwa][/s2If] [s2If current_user_can(access_s2member_level1)]
- Gold price is trading back-and-forth around $1,960.00 as investors await further triggers.
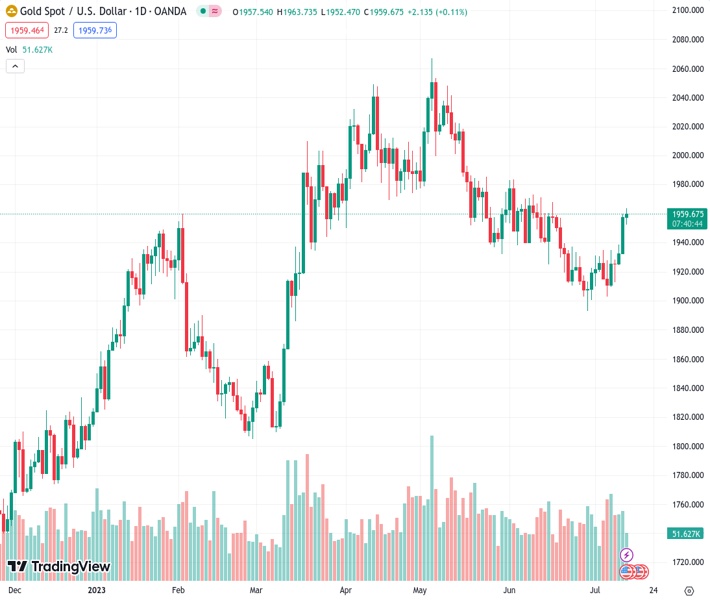
The pair currently trades last at 1959.65.
The previous day high was 1959.73 while the previous day low was 1932.22. The daily 38.2% Fib levels comes at 1949.22, expected to provide support. Similarly, the daily 61.8% fib level is at 1942.73, expected to provide support.
Gold price (XAU/USD) is demonstrating a non-directional performance around $1,960.00 as investors are awaiting United States Producer Price Index (PPI) data for further guidance. The US Dollar Index (DXY) is struggling to find any intermediate support as investors are hoping that the Federal Reserve (Fed) could tweak its old commentary of ‘two more rate hikes are appropriate’ after June’s soft inflation report.
S&P500 futures have generated significant gains in the European session, portraying the strong risk appetite of the market participants. As the second-quarter result season is on its way, sheer volatility in US equities cannot be ruled out. The yields offered on 10-year US Treasury bonds have rebounded to near 3.83%.
After soft inflation report, investors have shifted their focus towards the US PPI data, which will release at 12:30 GMT. As per the consensus, monthly headline and core PPI are expected to show a pace of 0.2%. Annual headline PPI is likely to decelerate to 0.4% vs. the former release of 1.1%. Sheer softening of prices of goods and services at factory gates would cool down inflationary pressures. Also, a decline in PPI would convey that the overall demand is in a declining stage.
Minneapolis Fed Bank President Neel Kashkari cited that policy rates needed to raise further and supervisors must ensure that banks are prepared to run new high-inflation stress tests to identify at-risk banks and size individual capital shortfalls.”, as reported by Reuters.
Gold price has delivered a breakout of the Wyckoff ‘Accumulation’ formed on a four-hour scale in which inventory is transferred from retail participants to institutional investors. The precious metal is in a ‘mark up’ phase and is expected to find stoppage near the horizontal resistance plotted from May 19 high at $1,984.25.
The Relative Strength Index (RSI) (14) has shifted into the bullish range of 60.00-80.00, indicating strength in the upside momentum.
Technical Levels: Supports and Resistances
XAUUSD currently trading at 1959.43 at the time of writing. Pair opened at 1957.48 and is trading with a change of 0.1 % .
| Overview | Overview.1 | |
|---|---|---|
| 0 | Today last price | 1959.43 |
| 1 | Today Daily Change | 1.95 |
| 2 | Today Daily Change % | 0.10 |
| 3 | Today daily open | 1957.48 |
The pair remains strongly bullish on the daily timeframe. It trades above its 20 SMA @ 1927.75, 50 SMA 1957.53, 100 SMA @ 1950.96 and 200 SMA @ 1869.98.
| Trends | Trends.1 | |
|---|---|---|
| 0 | Daily SMA20 | 1927.75 |
| 1 | Daily SMA50 | 1957.53 |
| 2 | Daily SMA100 | 1950.96 |
| 3 | Daily SMA200 | 1869.98 |
The previous day high was 1959.73 while the previous day low was 1932.22. The daily 38.2% Fib levels comes at 1949.22, expected to provide support. Similarly, the daily 61.8% fib level is at 1942.73, expected to provide support.
Note the levels of interest below:
- Pivot support is noted at 1939.89, 1922.3, 1912.38
- Pivot resistance is noted at 1967.4, 1977.32, 1994.91
| Levels | Levels.1 |
|---|---|
| Previous Daily High | 1959.73 |
| Previous Daily Low | 1932.22 |
| Previous Weekly High | 1935.09 |
| Previous Weekly Low | 1902.77 |
| Previous Monthly High | 1983.50 |
| Previous Monthly Low | 1893.01 |
| Daily Fibonacci 38.2% | 1949.22 |
| Daily Fibonacci 61.8% | 1942.73 |
| Daily Pivot Point S1 | 1939.89 |
| Daily Pivot Point S2 | 1922.30 |
| Daily Pivot Point S3 | 1912.38 |
| Daily Pivot Point R1 | 1967.40 |
| Daily Pivot Point R2 | 1977.32 |
| Daily Pivot Point R3 | 1994.91 |
[/s2If]
Download Nehcap EAWe have two EAs that are operational on our LIVE accounts.
- EA-FIX: Check out the details here. Download EA-FIX . EA-FIX is a non-grid HFT scalper.
- EA-GROWTH: High quality low dd EA using trend grids. Download EA_GROWTHJoin Our Telegram Group
")


