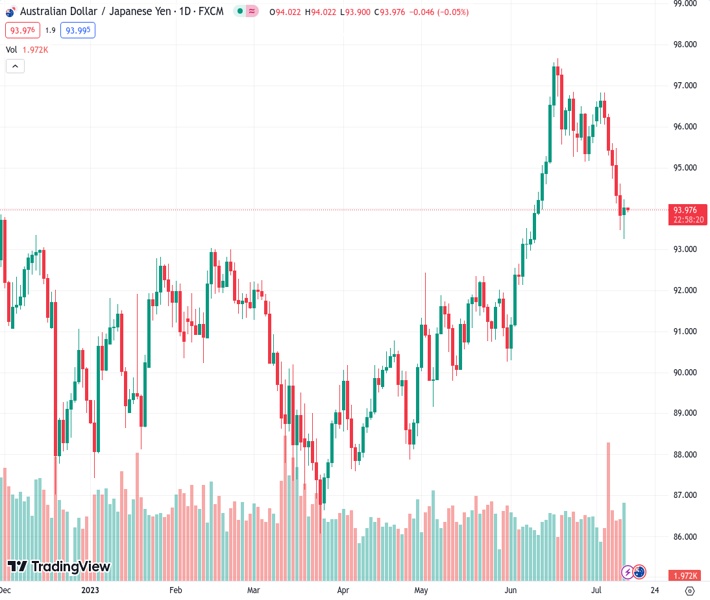
The AUDJPY pair, trading at 93.9310, has halted its five consecutive days of decline, managing to increase by 0.20% after rebounding from its lowest point of the week at 93.29. This indicates a minor upward movement in the trend.
…
This is a premium post.
[s2If !current_user_can(access_s2member_level4)]Please register for FREE REGISTER to read full post below containing analysis. In case of any error or you think you are not able to read the full post below, please email us at support#nehcap.com [lwa][/s2If] [s2If current_user_can(access_s2member_level1)]
- AUD/JPY snaps five days of losses, gaining 0.20% and bouncing off a weekly low of 93.29, showing a slight upward trend.
The pair currently trades last at 93.9310.
The previous day high was 94.61 while the previous day low was 93.48. The daily 38.2% Fib levels comes at 93.91, expected to provide support. Similarly, the daily 61.8% fib level is at 94.18, expected to provide resistance.
The AUD/JPY reached a weekly low of 93.29 but bounced off, snapped five days of consecutive losses on Wednesday, and gained 0.20%. As Thursday’s Asian session begins, the AUD/JPY exchanges hand at 93.95, registering minuscule losses of 0.02%.
The AUD/JPY remains neutral to upward biased, as it remains above the Ichimoku Cloud, but turned neutral as prices fell below the Tenkan-Sen and Kijun-Sen lines. Even though the former crossed beneath the latter, the Chikou Span stays on top of prices but is about to turn bearish, which would put into consideration a possible change of the trend.
If AUD/JPY reclaims 94.00, that could open the door for a retest of the November 16 high at 94.65, ahead of the pair reaching the 95.00 mark. Once cleared, the Tenkan-Sen could be tested at 95.04, followed by the Senkou Span A line at 95.48, and then the Kijun-Sen line at 95.32.
On the flip side, if the AUD/JPY drops below the Senkou Span B line at 93.42, the weekly lows of 93.29 would be exposed. The AUD/JPY 93.00 figure would be up next. Once broken, support emerges at May 19 high turned support ate 92.35.
Technical Levels: Supports and Resistances
AUDJPY currently trading at 93.98 at the time of writing. Pair opened at 93.86 and is trading with a change of 0.13 % .
| Overview | Overview.1 | |
|---|---|---|
| 0 | Today last price | 93.98 |
| 1 | Today Daily Change | 0.12 |
| 2 | Today Daily Change % | 0.13 |
| 3 | Today daily open | 93.86 |
The pair is trading below its 20 Daily moving average @ 95.97, above its 50 Daily moving average @ 93.44 , above its 100 Daily moving average @ 91.51 and above its 200 Daily moving average @ 91.83
| Trends | Trends.1 | |
|---|---|---|
| 0 | Daily SMA20 | 95.97 |
| 1 | Daily SMA50 | 93.44 |
| 2 | Daily SMA100 | 91.51 |
| 3 | Daily SMA200 | 91.83 |
The previous day high was 94.61 while the previous day low was 93.48. The daily 38.2% Fib levels comes at 93.91, expected to provide support. Similarly, the daily 61.8% fib level is at 94.18, expected to provide resistance.
Note the levels of interest below:
- Pivot support is noted at 93.35, 92.84, 92.21
- Pivot resistance is noted at 94.49, 95.12, 95.62
| Levels | Levels.1 |
|---|---|
| Previous Daily High | 94.61 |
| Previous Daily Low | 93.48 |
| Previous Weekly High | 96.84 |
| Previous Weekly Low | 94.74 |
| Previous Monthly High | 97.68 |
| Previous Monthly Low | 90.30 |
| Daily Fibonacci 38.2% | 93.91 |
| Daily Fibonacci 61.8% | 94.18 |
| Daily Pivot Point S1 | 93.35 |
| Daily Pivot Point S2 | 92.84 |
| Daily Pivot Point S3 | 92.21 |
| Daily Pivot Point R1 | 94.49 |
| Daily Pivot Point R2 | 95.12 |
| Daily Pivot Point R3 | 95.62 |
[/s2If]
Download Nehcap EAWe have two EAs that are operational on our LIVE accounts.
- EA-FIX: Check out the details here. Download EA-FIX . EA-FIX is a non-grid HFT scalper.
- EA-GROWTH: High quality low dd EA using trend grids. Download EA_GROWTHJoin Our Telegram Group
")


