The US dollar to Mexican peso exchange rate decreases to 17.0615, responding to an unsatisfactory US employment report and a decrease in Treasury bond yields. Investors are now looking ahead to the release of US inflation data.
…
This is a premium post.
[s2If !current_user_can(access_s2member_level4)]Please register for FREE REGISTER to read full post below containing analysis. In case of any error or you think you are not able to read the full post below, please email us at support#nehcap.com [lwa][/s2If] [s2If current_user_can(access_s2member_level1)]
- USD/MXN drops following disappointing US jobs report and a decline in Treasury yields; market anticipates upcoming US inflation data.
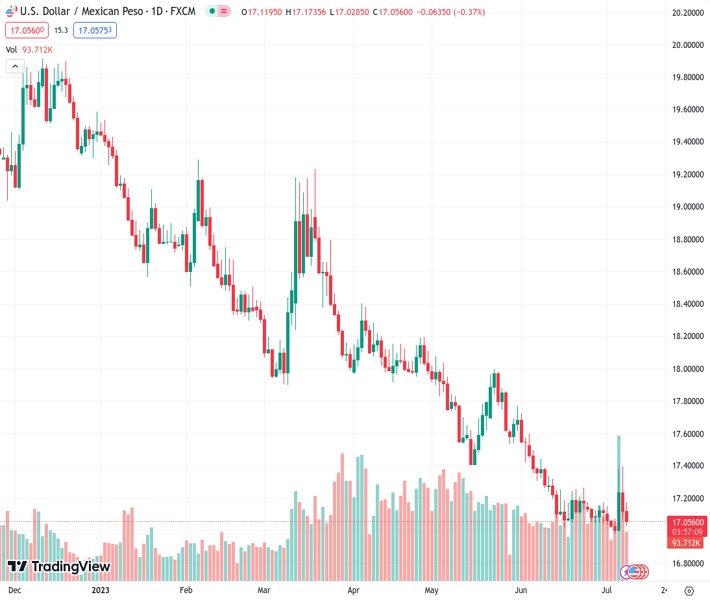
The pair currently trades last at 17.0615.
The previous day high was 17.3957 while the previous day low was 17.0712. The daily 38.2% Fib levels comes at 17.1951, expected to provide resistance. Similarly, the daily 61.8% fib level is at 17.2717, expected to provide resistance.
USD/MXN retraces from last week’s high of 17.3828, spurred by an improvement in market sentiment and broad US Dollar (USD) weakness, sparked by a fall in US Treasury bond yields, while traders brace for the release of inflation figures in the United States (US). At the time of writing, the USD/MXN is trading at 17.0611 after hitting a daily high of 17.1735, down 0.34%
The last week’s jobs report in the US continues to drag the greenback lower, as the data showed the economy adding just 209K jobs in June, below estimates, signaling the labor market is cooling. That triggered another leg-down in the USD/MXN pair, even though the Unemployment Rate edged lower, suggesting the opposite. That, alongside a rise in the Average Hourly Earnings (AHE) expanding 4.4% YoY, above the prior month’s 4.2%, warrants the tightness of the labor market.
Regarding the labor market, the Cleveland Fed President Loretta Mester commented that the economy is still robust while saying, “When the economy reopened, labor demand well outpaced labor supply, putting upward pressure on wages and price inflation.” She stated, “More hikes needed to bring inflation back down to target.”
Other Fed officials echoed some of her comments, like the San Francisco Fed President Mary Daly stating there’s more to be done, opening the door for a couple of hikes. She added that inflation and growth risks became more “balanced,” but the risks of doing too little outpace the threats of overtightening.
Aside from this, USD/MXN traders are eyeing the release of June’s US inflation figures on Wednesday at around 12:30 GMT. The Consumer Price Index (CPI) is expected to decelerate to 3.1% YoY from 4%, while the core CPI, which excludes volatile items, is foreseen to dip to 5% YoY beneath May’s 5.3%.
As of writing, the US Dollar Index, a gauge of the buck’s value vs. a basket of peers, falls 0.17% down to 102.090, eyeing a fall to a new five-week low. US Treasury bond yields continue to trim some of the last week’s gains, with the 10-year benchmark note rate at 4.01%, down six basis points.
On the Mexico front, the latest inflation data revealed by INEGI shows June’s CPI falling for the fifth consecutive month to 5.06%, a drop of 0.10% in June, exceeding estimates of -0.09%. Annual core CPI which strips volatile items, was 6.89% in June, above forecasts of 6.87%.
Regarding monetary policy, the CME FedWatch Tool shows odds for a Fed 25 bps hike standing at 92.4%, higher than last week’s 86.8%; nonetheless, investors are not estimating additional tightening, although the latest dot-plot shows the Federal Funds Rate (FFR) peaking at 5.6%. According to comments made by its Governor Victoria Rodriguez Ceja, the Bank of Mexico (Banxico) is expected to hold rates unchanged to keep rates higher.
The USD/MXN is still downward biased as buyers failed to reclaim the 50-day Exponential Moving Average (EMA) at 17.4185, and the May 17 swing low turned resistance at 17.4038. A breach of that area is needed to change the pair’s bias to neutral, and that could pave the way to challenge the 100-day EMA at 17.8110 and the 18.00 mark. Conversely, further downside is expected, and a test of the year-to-date (YTD) low of 16.9761 when the USD/MXN falls below 17.00.
Technical Levels: Supports and Resistances
USDMXN currently trading at 17.051 at the time of writing. Pair opened at 17.1392 and is trading with a change of -0.51 % .
| Overview | Overview.1 | |
|---|---|---|
| 0 | Today last price | 17.0510 |
| 1 | Today Daily Change | -0.0882 |
| 2 | Today Daily Change % | -0.5100 |
| 3 | Today daily open | 17.1392 |
The pair remains strongly bearish on the daily time frame. It trades below the 20 SMA @ 17.132, 50 SMA 17.4515, 100 SMA @ 17.8601 and 200 SMA @ 18.6248.
| Trends | Trends.1 | |
|---|---|---|
| 0 | Daily SMA20 | 17.1320 |
| 1 | Daily SMA50 | 17.4515 |
| 2 | Daily SMA100 | 17.8601 |
| 3 | Daily SMA200 | 18.6248 |
The previous day high was 17.3957 while the previous day low was 17.0712. The daily 38.2% Fib levels comes at 17.1951, expected to provide resistance. Similarly, the daily 61.8% fib level is at 17.2717, expected to provide resistance.
Note the levels of interest below:
- Pivot support is noted at 17.0083, 16.8775, 16.6838
- Pivot resistance is noted at 17.3329, 17.5265, 17.6574
| Levels | Levels.1 |
|---|---|
| Previous Daily High | 17.3957 |
| Previous Daily Low | 17.0712 |
| Previous Weekly High | 17.3957 |
| Previous Weekly Low | 16.9803 |
| Previous Monthly High | 17.7286 |
| Previous Monthly Low | 17.0243 |
| Daily Fibonacci 38.2% | 17.1951 |
| Daily Fibonacci 61.8% | 17.2717 |
| Daily Pivot Point S1 | 17.0083 |
| Daily Pivot Point S2 | 16.8775 |
| Daily Pivot Point S3 | 16.6838 |
| Daily Pivot Point R1 | 17.3329 |
| Daily Pivot Point R2 | 17.5265 |
| Daily Pivot Point R3 | 17.6574 |
[/s2If]
Download Nehcap EAWe have two EAs that are operational on our LIVE accounts.
- EA-FIX: Check out the details here. Download EA-FIX . EA-FIX is a non-grid HFT scalper.
- EA-GROWTH: High quality low dd EA using trend grids. Download EA_GROWTHJoin Our Telegram Group
")


