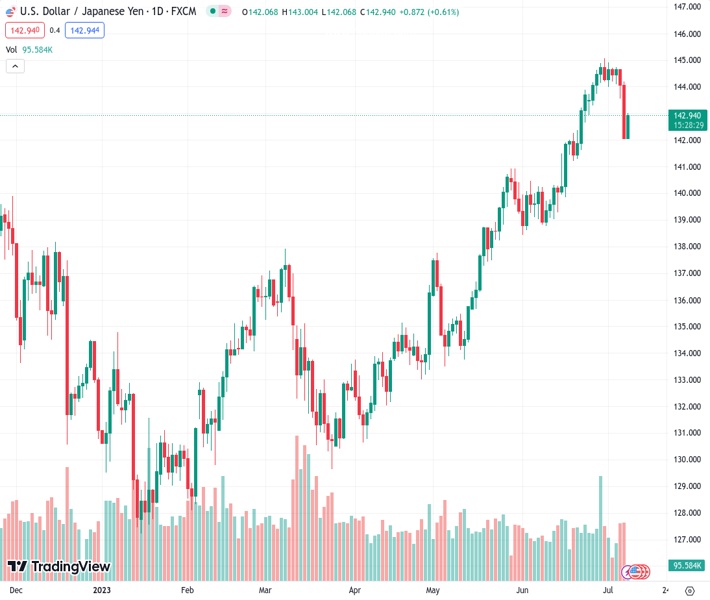
#USDJPY at 142.940 lures in a few purchasers and experiences an upsurge to around the 143.00 area.
…
This is a premium post.
[s2If !current_user_can(access_s2member_level4)]Please register for FREE REGISTER to read full post below containing analysis. In case of any error or you think you are not able to read the full post below, please email us at support#nehcap.com [lwa][/s2If] [s2If current_user_can(access_s2member_level1)]
- USD/JPY attracts some buyers and sees a rally to near the 143.00 region
The pair currently trades last at 142.940.
The previous day high was 144.2 while the previous day low was 142.07. The daily 38.2% Fib levels comes at 142.89, expected to provide support. Similarly, the daily 61.8% fib level is at 143.39, expected to provide resistance.
The USD/JPY pair gains momentum and sees a rally to near the 143.00 threshold in the Asian session, up 0.57% on the day. The major pair recovers a part of Friday’s losses to its over-a-one-week low at 142.06 as the US Dolla Indexr (DXY) stages a decent comeback early Monday.
The Labor Department’s closely-watched employment report showed on Friday that the US economy added jobs slower than anticipated pace in June. The US Nonfarm Payrolls (NFP) rose by 209,000 in June, down from 306,000 seen in May. Additionally, the Unemployment Rate dropped from 3.7% to 3.6% in June and Average Hourly Earnings remained unchanged at 0.4%, above the market expectation of 0.3%.
Following the softer US data, USD/JPY saw a sharp drop to a one-week low, rebounding firmly in Monday’s Asian session, tracking the recovery in the US Dollar in tandem with the US Treasury bond yields.
The US labor data suggested that the Federal Reserve (Fed) could refrain from hiking rates twice this year, as previously expected.
However, market players remain certain the US Federal Reserve (Fed) will increase rates by 25 basis points (bps) at the July 25-26 policy meeting, according to the CME Group’s FedWatch Tool. At the moment, the odds are at 92.4%, higher than last week’s 86.8%. This, in turn, supports d the renewed upside in the US Treasury bond yields, lifting the US Dollar across the board.
From the Japanese docket, “the latest data from the Ministry of Finance showed on Monday that Japan’s current account surplus more than doubled year-on-year in May, the fourth consecutive month of gains, as the country’s trade deficit narrowed and income gains from its overseas investment expanded,” said Reuters.
According to a Reuters poll, the current account surplus reached 1.86 trillion yen ($13.08 billion) in May, compared with 773 billion yen YoY and below the median forecast for a surplus of 1.88 trillion yen.
That said, the possible FX intervention by the Japanese central bank might keep USD/JPY’s upside in check as the top currency diplomat Masato Kanda said that he was communicating with various countries, including the US over currencies, per Reuters.
Looking ahead, market participants will focus on the US Consumer Price Index (CPI), the Producer Price Index (PPI) and the US University of Michigan Preliminary Consumer Sentiment (July) later in the week. Meanwhile, The Japanese Producer Price Index (PPI) YoY and revised Industrial Production MoM will be featured on Wednesday and Friday. Traders might prefer to wait on the sidelines ahead of the key data released.
Technical Levels: Supports and Resistances
USDJPY currently trading at 142.91 at the time of writing. Pair opened at 142.15 and is trading with a change of 0.53 % .
| Overview | Overview.1 | |
|---|---|---|
| 0 | Today last price | 142.91 |
| 1 | Today Daily Change | 0.75 |
| 2 | Today Daily Change % | 0.53 |
| 3 | Today daily open | 142.15 |
The pair remains strongly bullish on the daily timeframe. It trades above its 20 SMA @ 142.77, 50 SMA 139.76, 100 SMA @ 136.8 and 200 SMA @ 137.22.
| Trends | Trends.1 | |
|---|---|---|
| 0 | Daily SMA20 | 142.77 |
| 1 | Daily SMA50 | 139.76 |
| 2 | Daily SMA100 | 136.80 |
| 3 | Daily SMA200 | 137.22 |
The previous day high was 144.2 while the previous day low was 142.07. The daily 38.2% Fib levels comes at 142.89, expected to provide support. Similarly, the daily 61.8% fib level is at 143.39, expected to provide resistance.
Note the levels of interest below:
- Pivot support is noted at 141.41, 140.68, 139.28
- Pivot resistance is noted at 143.54, 144.93, 145.67
| Levels | Levels.1 |
|---|---|
| Previous Daily High | 144.20 |
| Previous Daily Low | 142.07 |
| Previous Weekly High | 144.91 |
| Previous Weekly Low | 142.07 |
| Previous Monthly High | 145.07 |
| Previous Monthly Low | 138.43 |
| Daily Fibonacci 38.2% | 142.89 |
| Daily Fibonacci 61.8% | 143.39 |
| Daily Pivot Point S1 | 141.41 |
| Daily Pivot Point S2 | 140.68 |
| Daily Pivot Point S3 | 139.28 |
| Daily Pivot Point R1 | 143.54 |
| Daily Pivot Point R2 | 144.93 |
| Daily Pivot Point R3 | 145.67 |
[/s2If]
Download Nehcap EAWe have two EAs that are operational on our LIVE accounts.
- EA-FIX: Check out the details here. Download EA-FIX . EA-FIX is a non-grid HFT scalper.
- EA-GROWTH: High quality low dd EA using trend grids. Download EA_GROWTHJoin Our Telegram Group
")


