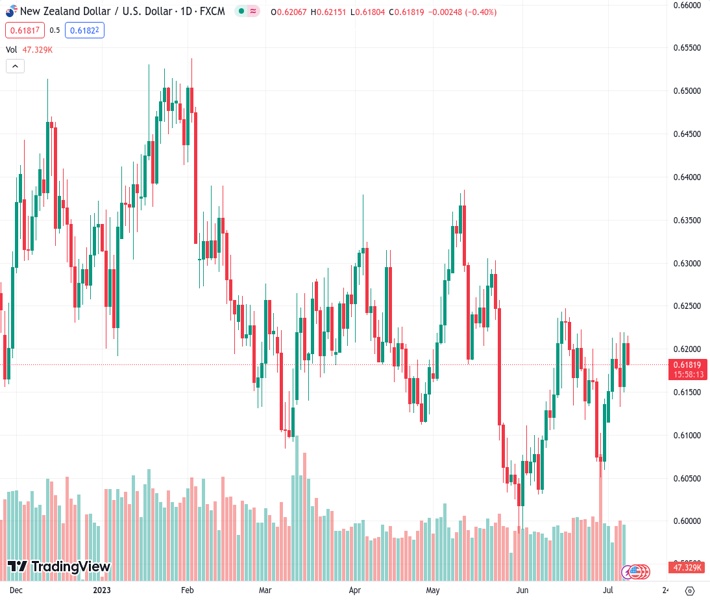
Sellers are drawn to the NZDUSD currency pair at a rate of 0.61818, as the presence of USD buyers is causing downward pressure on it on Monday.
…
This is a premium post.
[s2If !current_user_can(access_s2member_level4)]Please register for FREE REGISTER to read full post below containing analysis. In case of any error or you think you are not able to read the full post below, please email us at support#nehcap.com [lwa][/s2If] [s2If current_user_can(access_s2member_level1)]
- NZD/USD attract some sellers on Monday and is pressured by the emergence of some USD buying.
The pair currently trades last at 0.61818.
The previous day high was 0.6221 while the previous day low was 0.6153. The daily 38.2% Fib levels comes at 0.6195, expected to provide resistance. Similarly, the daily 61.8% fib level is at 0.6179, expected to provide support.
The NZD/USD pair meets with a fresh supply on the first day of a new week and erodes a part of Friday’s strong move up to the 0.6220 area, or over a two-week high. The steady intraday descent drags spot prices to the 0.6180 region during the Asian session and is sponsored by the emergence of some buying around the US Dollar (USD).
In fact, the USD Index (DXY), which tracks the Greenback against a basket of currencies, regains positive traction and snaps a two-day losing streak to its lowest level since June 22, touched on Friday in the aftermath of the rather unimpressive US jobs data. It is worth recalling that the headline NFP print showed that the US economy added 209K jobs in June, marking the fewest in 2-1/2 years and signalling that the job market is cooling. This could allow the Federal Reserve (Fed) to soften its hawkish stance, which, in turn, weighed heavily on the buck.
That said, the persistently strong wage growth and a slight drop in the unemployment rate pointed to still tight labor market conditions. This reaffirms market expectations that the US central bank will hike interest rates by 25 bps at the July meeting. The outlook remains supportive of elevated US Treasury bond yields and lends some support to the USD. Apart from this, a generally weaker risk tone further benefits the Greenback’s relative safe-haven status and contributes to driving flows away from the perceived riskier New Zealand Dollar (NZD).
A slew of weak economic data from China released over the past week or so, including the softer inflation figures on Monday, add to worries about slowing growth in the world’s second-largest economy. Furthermore, the risk of a further escalation in the US-China trade conflict continues to weigh on investors’ sentiment, which is evident from a generally weaker tone around the equity markets. This, in turn, is seen as another factor weighing on antipodean currencies, including the Kiwi, and supports prospects for a further depreciating move for the NZD/USD pair.
Traders, however, might refrain from placing aggressive bets and prefer to wait on the sidelines ahead of the Reserve Bank of New Zealand (RBNZ) monetary policy meeting on Wednesday. This will be followed by the crucial US consumer inflation figures, which will play a key role in influencing the Fed’s near-term policy outlook. In the meantime, traders will take cues from the broader risk sentiment, which will drive demand for the safe-haven USD and provide some impetus to the NZD/USD pair in the absence of any relevant macro data from the US.
Technical Levels: Supports and Resistances
NZDUSD currently trading at 0.6183 at the time of writing. Pair opened at 0.6199 and is trading with a change of -0.26 % .
| Overview | Overview.1 | |
|---|---|---|
| 0 | Today last price | 0.6183 |
| 1 | Today Daily Change | -0.0016 |
| 2 | Today Daily Change % | -0.2600 |
| 3 | Today daily open | 0.6199 |
The pair is trading above its 20 Daily moving average @ 0.6163, above its 50 Daily moving average @ 0.6169 , below its 100 Daily moving average @ 0.6189 and above its 200 Daily moving average @ 0.6175
| Trends | Trends.1 | |
|---|---|---|
| 0 | Daily SMA20 | 0.6163 |
| 1 | Daily SMA50 | 0.6169 |
| 2 | Daily SMA100 | 0.6189 |
| 3 | Daily SMA200 | 0.6175 |
The previous day high was 0.6221 while the previous day low was 0.6153. The daily 38.2% Fib levels comes at 0.6195, expected to provide resistance. Similarly, the daily 61.8% fib level is at 0.6179, expected to provide support.
Note the levels of interest below:
- Pivot support is noted at 0.6161, 0.6123, 0.6093
- Pivot resistance is noted at 0.6229, 0.6259, 0.6297
| Levels | Levels.1 |
|---|---|
| Previous Daily High | 0.6221 |
| Previous Daily Low | 0.6153 |
| Previous Weekly High | 0.6221 |
| Previous Weekly Low | 0.6124 |
| Previous Monthly High | 0.6250 |
| Previous Monthly Low | 0.5990 |
| Daily Fibonacci 38.2% | 0.6195 |
| Daily Fibonacci 61.8% | 0.6179 |
| Daily Pivot Point S1 | 0.6161 |
| Daily Pivot Point S2 | 0.6123 |
| Daily Pivot Point S3 | 0.6093 |
| Daily Pivot Point R1 | 0.6229 |
| Daily Pivot Point R2 | 0.6259 |
| Daily Pivot Point R3 | 0.6297 |
[/s2If]
Download Nehcap EAWe have two EAs that are operational on our LIVE accounts.
- EA-FIX: Check out the details here. Download EA-FIX . EA-FIX is a non-grid HFT scalper.
- EA-GROWTH: High quality low dd EA using trend grids. Download EA_GROWTHJoin Our Telegram Group
")


