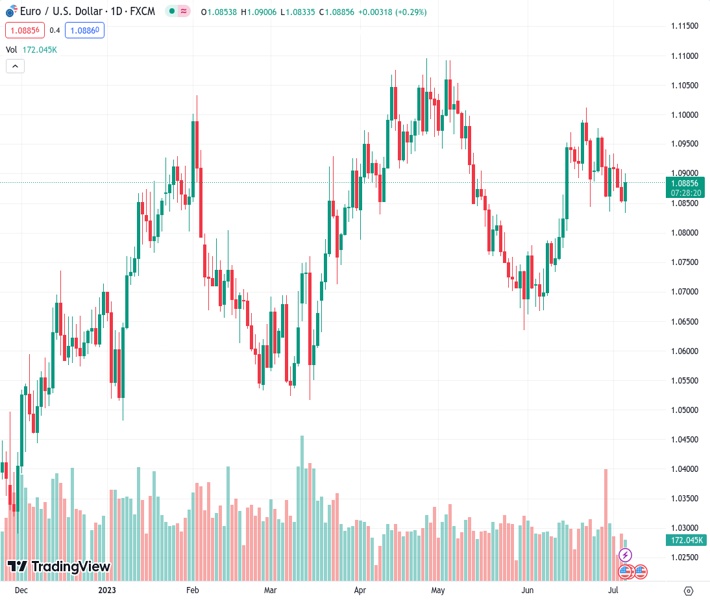
The EURUSD currency pair, which was trading at 1.08848, has experienced a reversal after three consecutive days of pullbacks.
…
This is a premium post.
[s2If !current_user_can(access_s2member_level4)]Please register for FREE REGISTER to read full post below containing analysis. In case of any error or you think you are not able to read the full post below, please email us at support#nehcap.com [lwa][/s2If] [s2If current_user_can(access_s2member_level1)]
- EUR/USD reverses three consecutive daily pullbacks.
The pair currently trades last at 1.08848.
The previous day high was 1.0908 while the previous day low was 1.0851. The daily 38.2% Fib levels comes at 1.0873, expected to provide support. Similarly, the daily 61.8% fib level is at 1.0886, expected to provide resistance.
EUR/USD manages to leave behind part of the recent decline and trades with decent gains near the 1.0900 barrier on Thursday.
The inability of the pair to regain a convincing upside traction, ideally in the very near term, could motivate sellers to force the pair to revisit recent lows near 1.0830 ahead of the interim support at the 100-day SMA at 1.0824.
Looking at the longer run, the positive view remains unchanged while above the 200-day SMA, today at 1.0613.
Technical Levels: Supports and Resistances
EURUSD currently trading at 1.087 at the time of writing. Pair opened at 1.0854 and is trading with a change of 0.15 % .
| Overview | Overview.1 | |
|---|---|---|
| 0 | Today last price | 1.0870 |
| 1 | Today Daily Change | 67.0000 |
| 2 | Today Daily Change % | 0.1500 |
| 3 | Today daily open | 1.0854 |
The pair is trading below its 20 Daily moving average @ 1.0884, above its 50 Daily moving average @ 1.0863 , above its 100 Daily moving average @ 1.0824 and above its 200 Daily moving average @ 1.0609
| Trends | Trends.1 | |
|---|---|---|
| 0 | Daily SMA20 | 1.0884 |
| 1 | Daily SMA50 | 1.0863 |
| 2 | Daily SMA100 | 1.0824 |
| 3 | Daily SMA200 | 1.0609 |
The previous day high was 1.0908 while the previous day low was 1.0851. The daily 38.2% Fib levels comes at 1.0873, expected to provide support. Similarly, the daily 61.8% fib level is at 1.0886, expected to provide resistance.
Note the levels of interest below:
- Pivot support is noted at 1.0834, 1.0814, 1.0777
- Pivot resistance is noted at 1.0891, 1.0928, 1.0948
| Levels | Levels.1 |
|---|---|
| Previous Daily High | 1.0908 |
| Previous Daily Low | 1.0851 |
| Previous Weekly High | 1.0977 |
| Previous Weekly Low | 1.0835 |
| Previous Monthly High | 1.1012 |
| Previous Monthly Low | 1.0662 |
| Daily Fibonacci 38.2% | 1.0873 |
| Daily Fibonacci 61.8% | 1.0886 |
| Daily Pivot Point S1 | 1.0834 |
| Daily Pivot Point S2 | 1.0814 |
| Daily Pivot Point S3 | 1.0777 |
| Daily Pivot Point R1 | 1.0891 |
| Daily Pivot Point R2 | 1.0928 |
| Daily Pivot Point R3 | 1.0948 |
[/s2If]
Nehcap Expert Advisor
The NEHCAP MT4 EA is high quality professional trading system geared to generate returns without using GRID or martingales. Each trade has strict risk per trade parameter. The pairs under management include EURUSD, GBPUSD, AUDCAD, AUDNZD,GBPAUD, EURAUD, EURCAD, CHFJPY and many more.
The system is trading live: LIVE ACCOUNT TRACKING
You can run it free. Apply for a free trial and track our account. Buy the system or use profit share mechanism to generate returns on your MT4.
Join Our Telegram Group
")


